PySpectrum
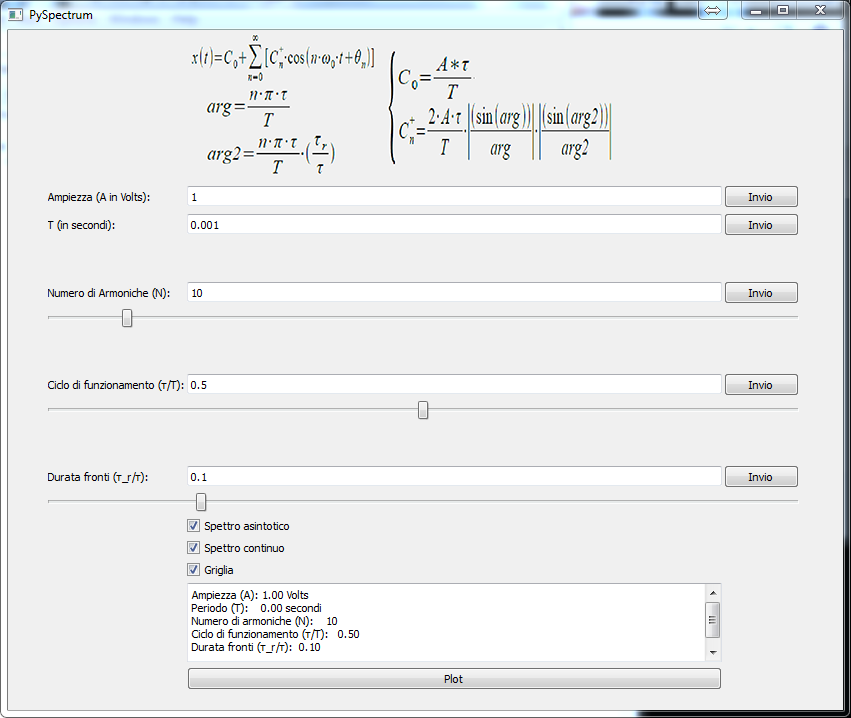
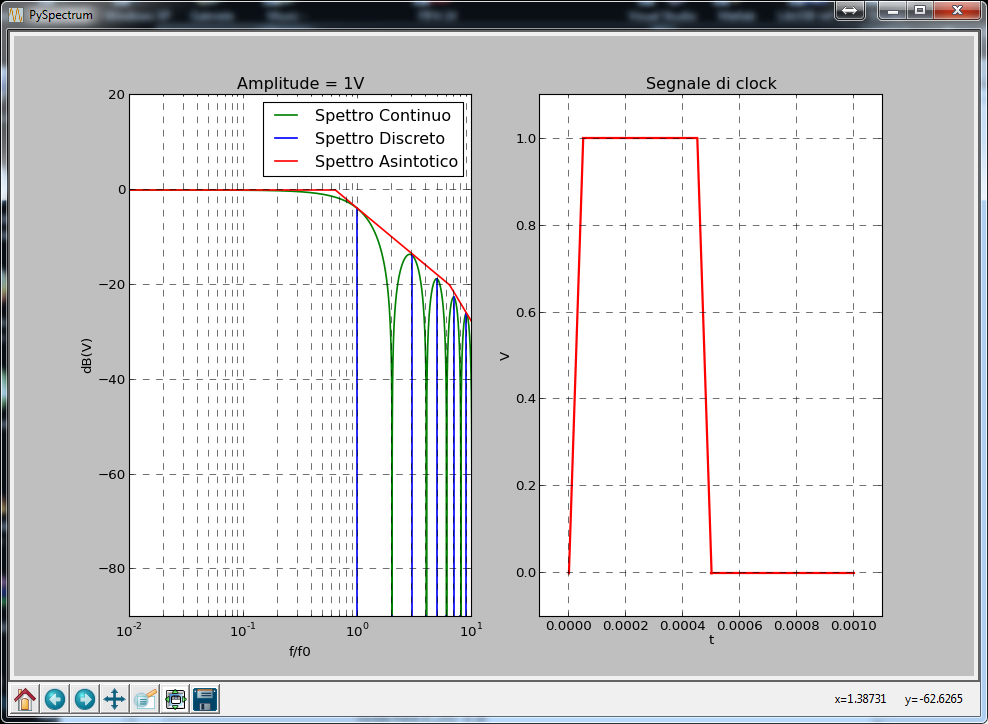
For the class of “Electromagnetic Compatibility” I decided to implement a Python program that could plot the emitted spectrum. The program had to aim of helping me in the solution of exercises and in the analysis of some electronic configuration. I put into practice for this program the theory of the course.
In the following pictures there are some screenshots related to the software.