Modbus Simulator
During my professional career, it happened several times to be dealing with Industrial Protocols and in particular to have to develop or test some client that uses Modbus TCP. In particular, the difficulty in the development of the Client was not related to the development itself but to the need of being able to test new software without having to be in the lab (industrial equipment is not really handy to carry around).
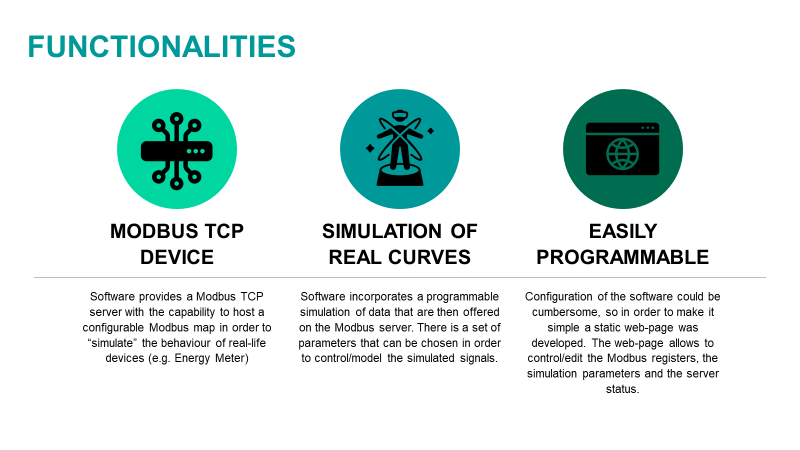
The aim of the project is therefore to:
- Develop a Modbus TCP server able to respond to requests based on its map;
- Simulate real curves in order to allow the client to understand if the server is actually working or not;
- Allow a easy programming of the Modbus map without having to touch the code or local files.
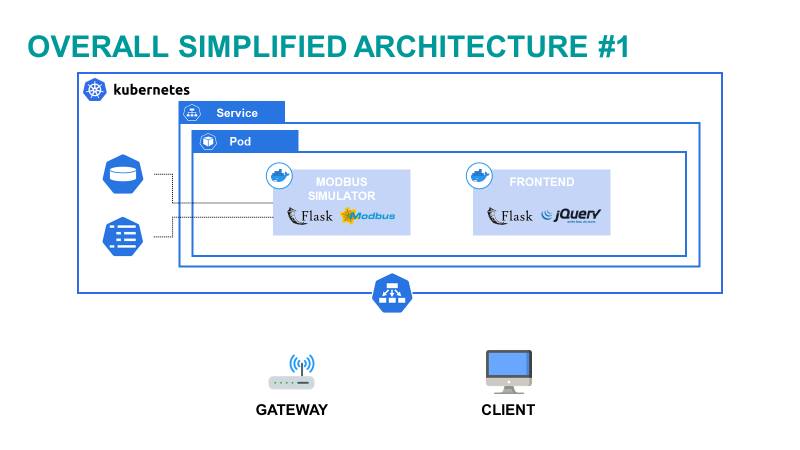
The overall system is composed by:
- Kubernetes-based containerised software that serves the Modbus TCP server and the configuration tool;
- Client which uses a standard browser to command and configure the Modbus TCP server;
- Modbus client (e.g. Gateway) that polls for collecting data.
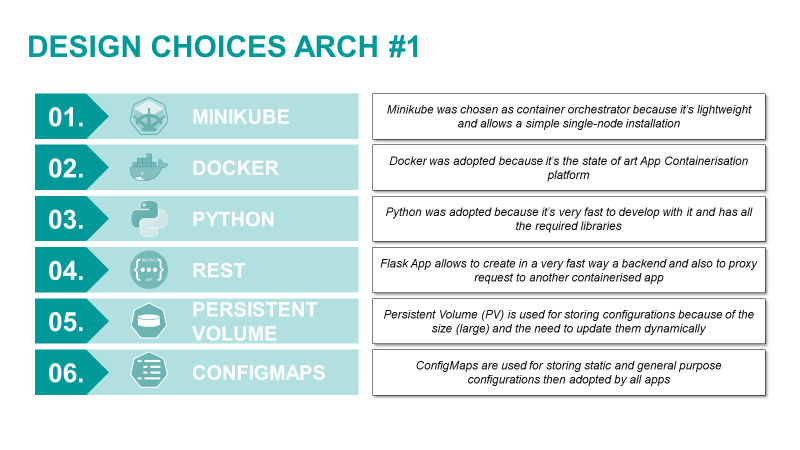
Here below some detail regarding the design choices that were taken for designing and implementing said systems.
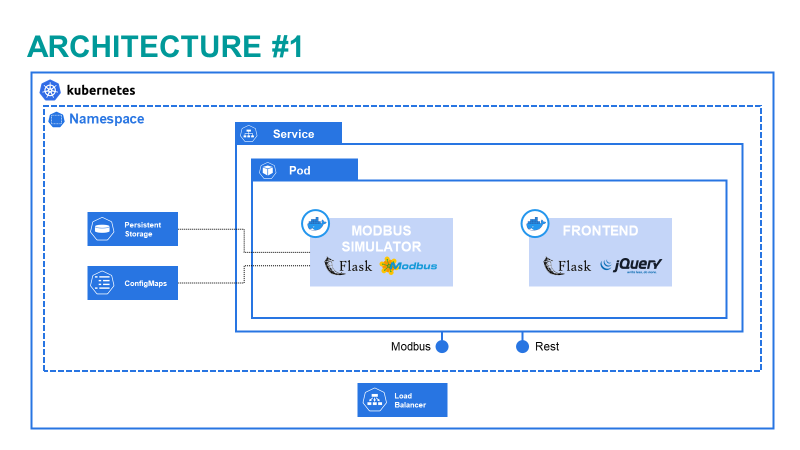
Modbus Simulator
Here below there is the graphical representation of the containerised software that implements the Modbus Simulator:
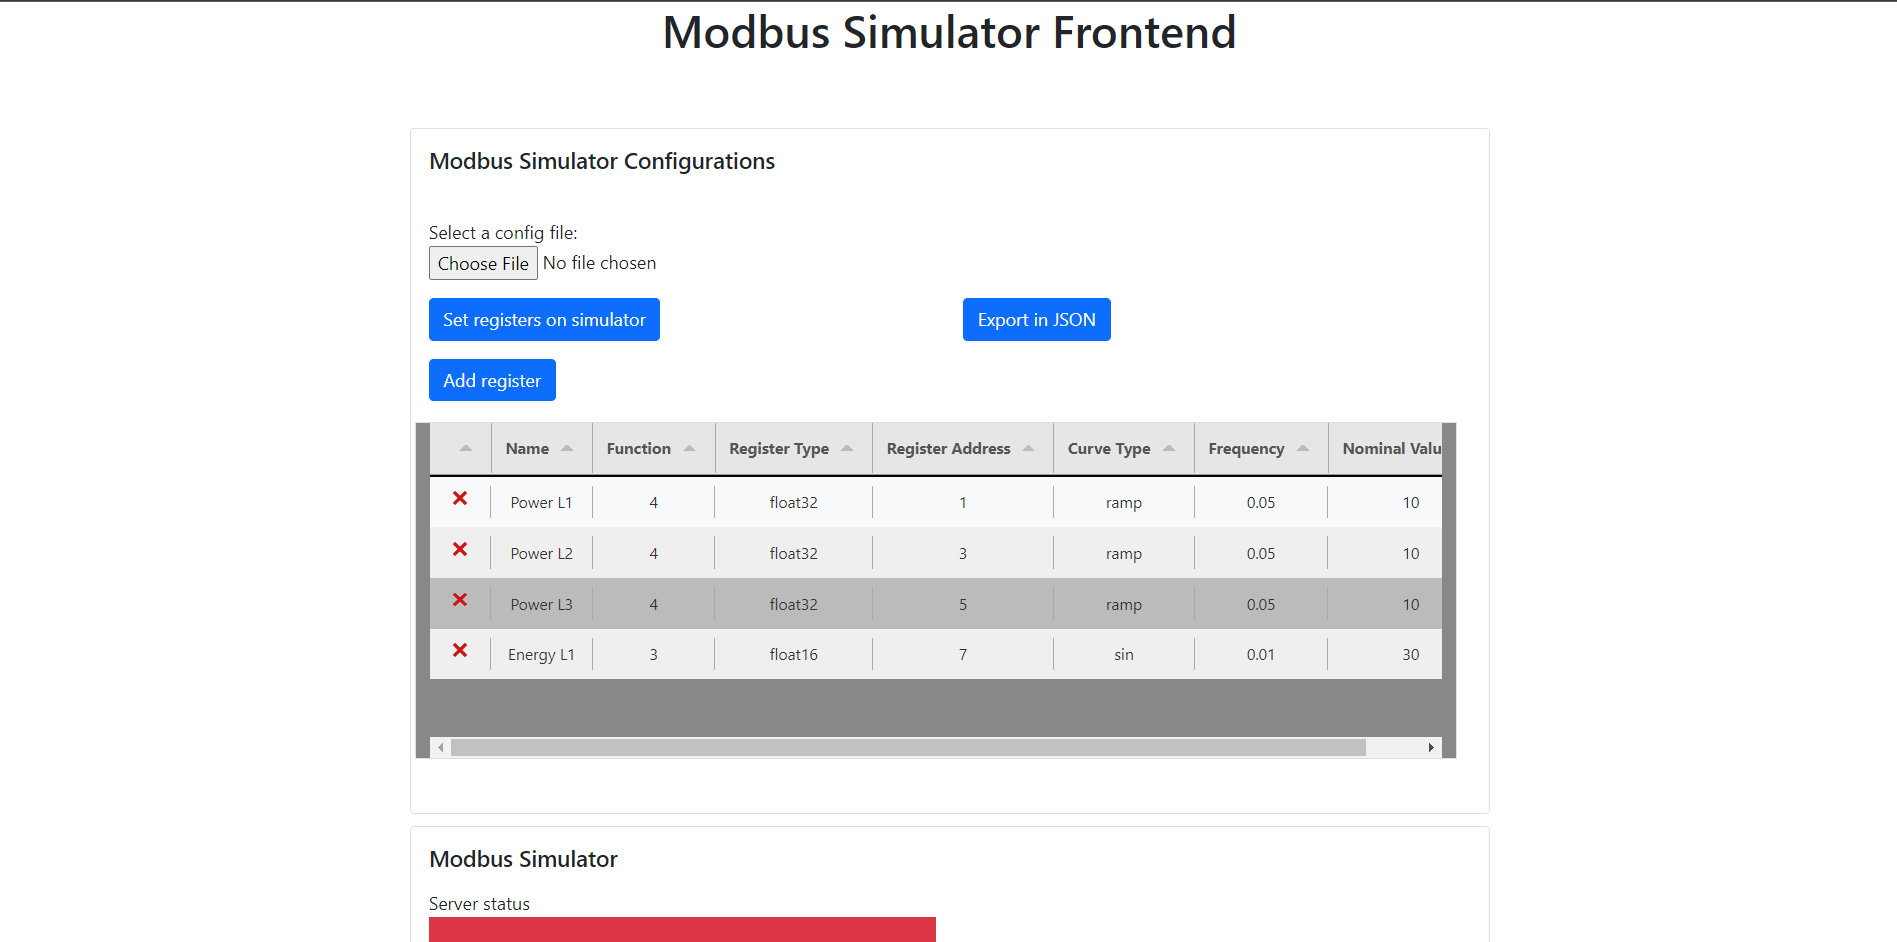
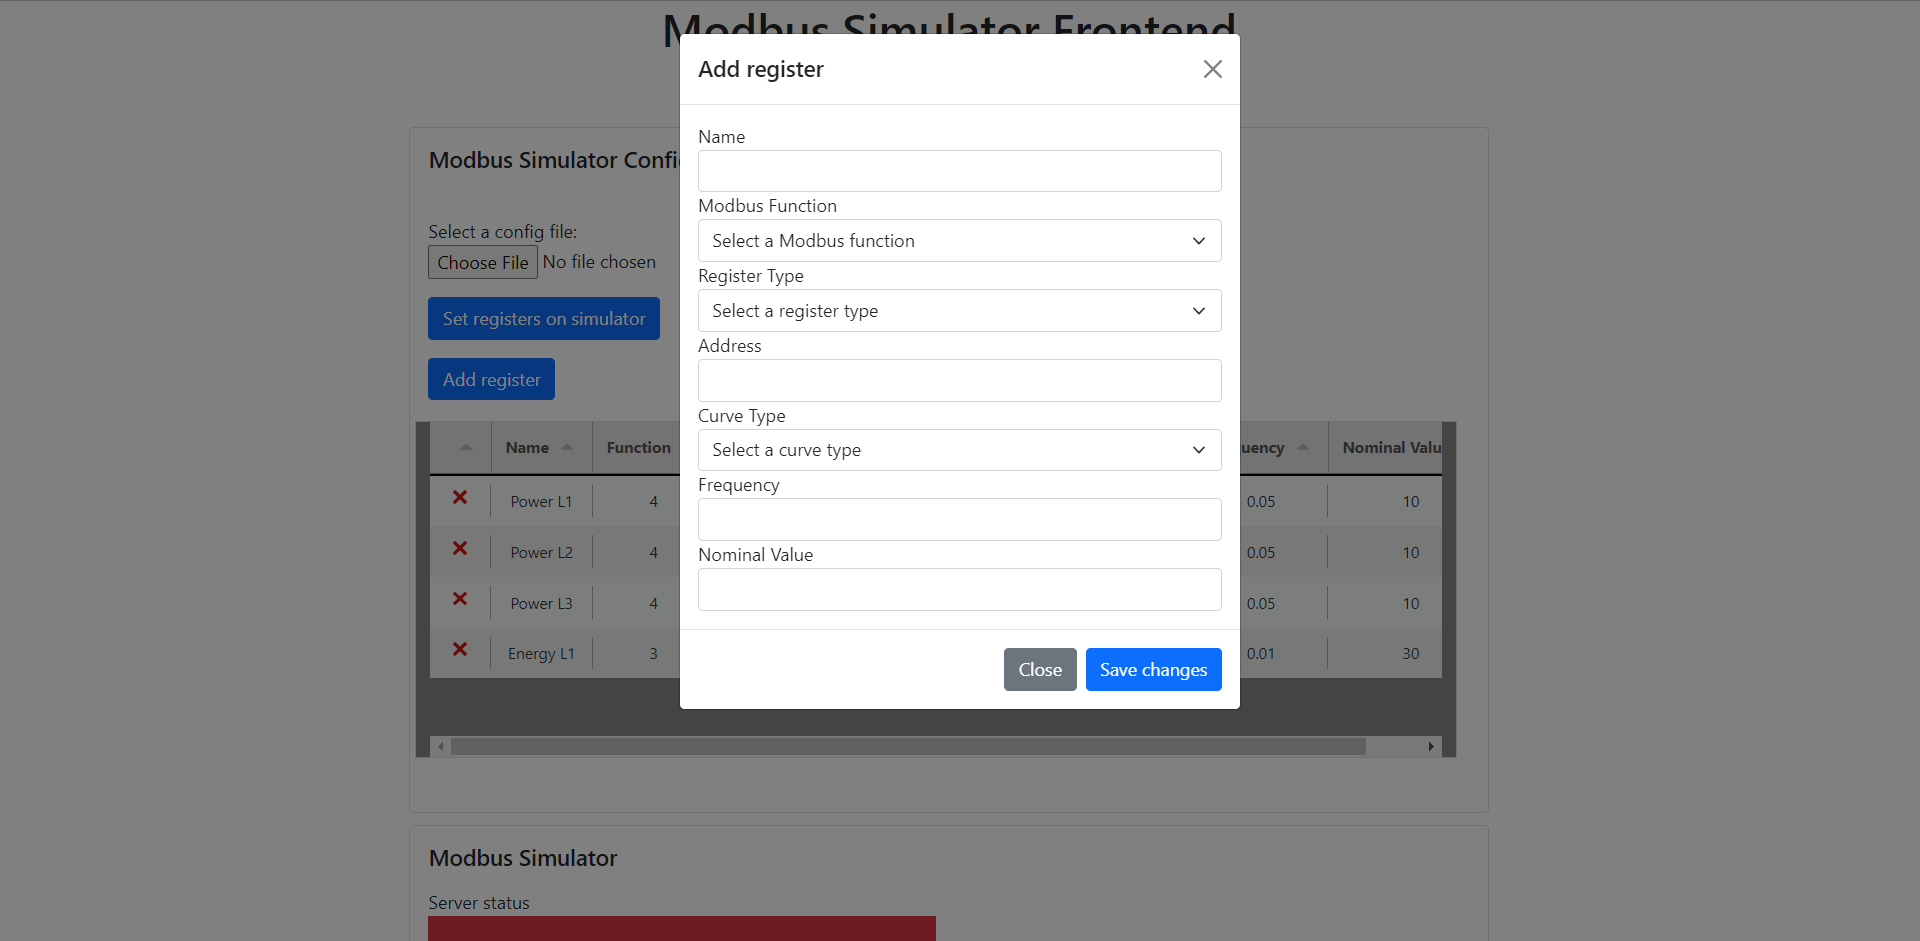
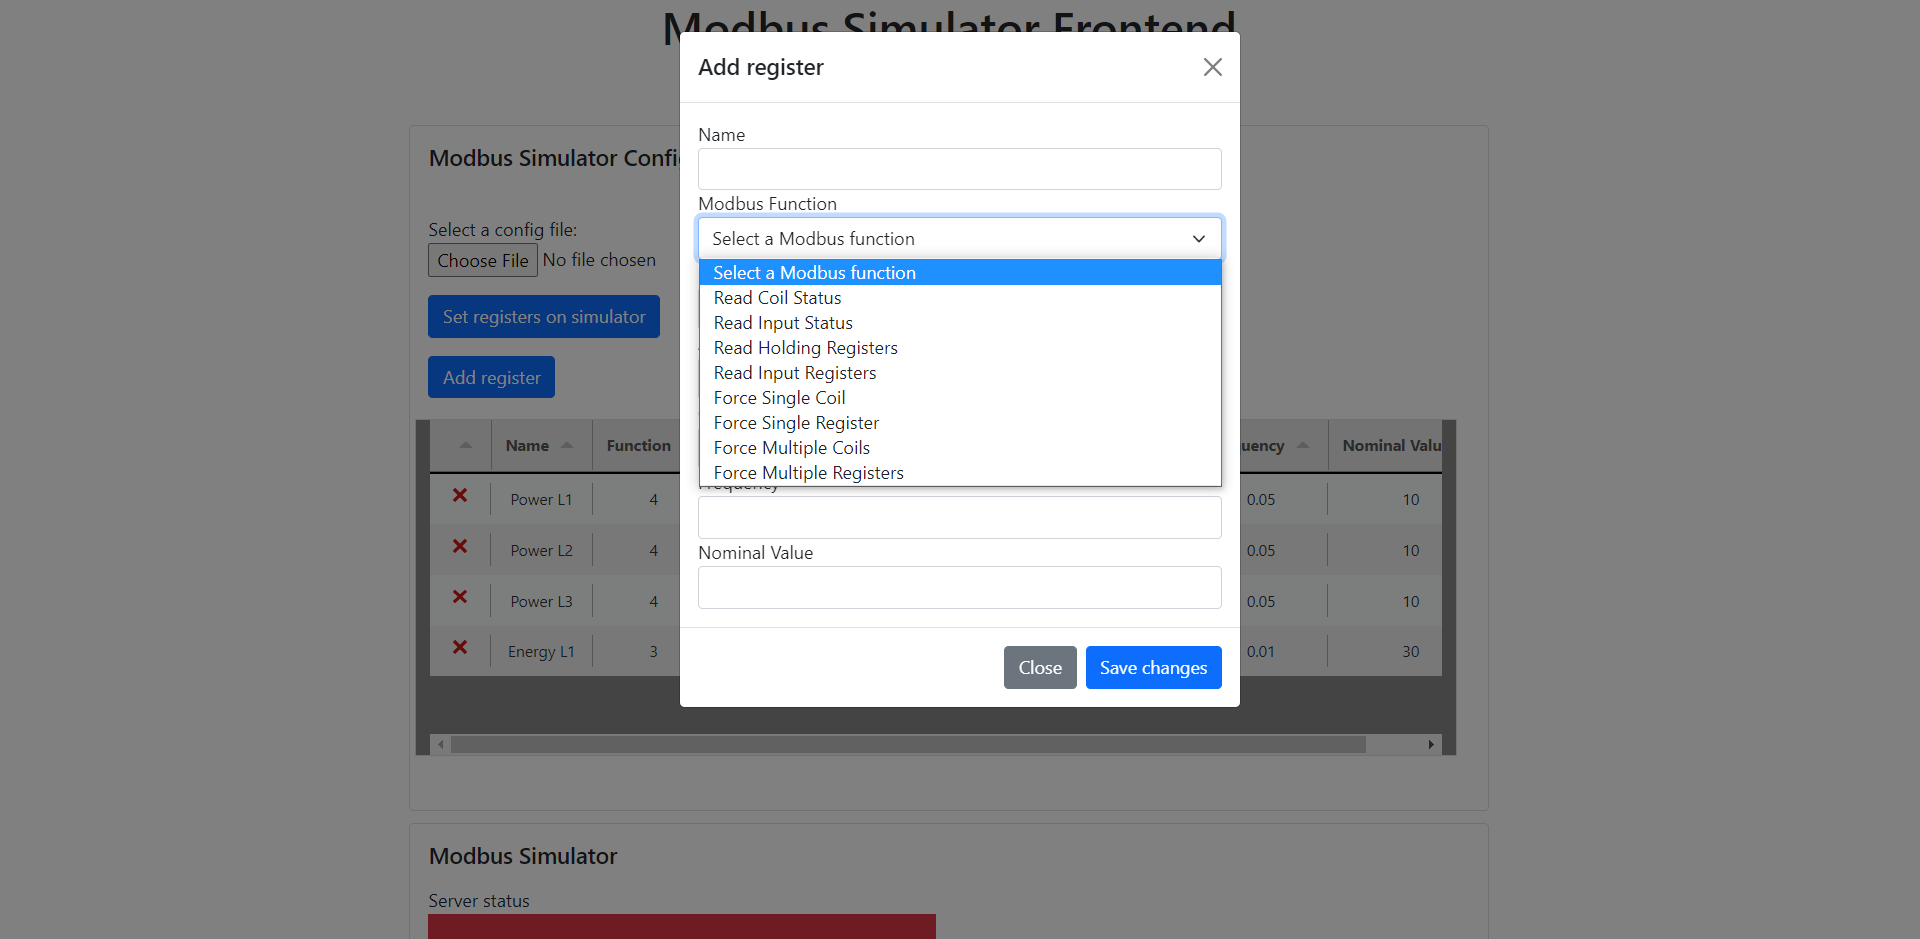
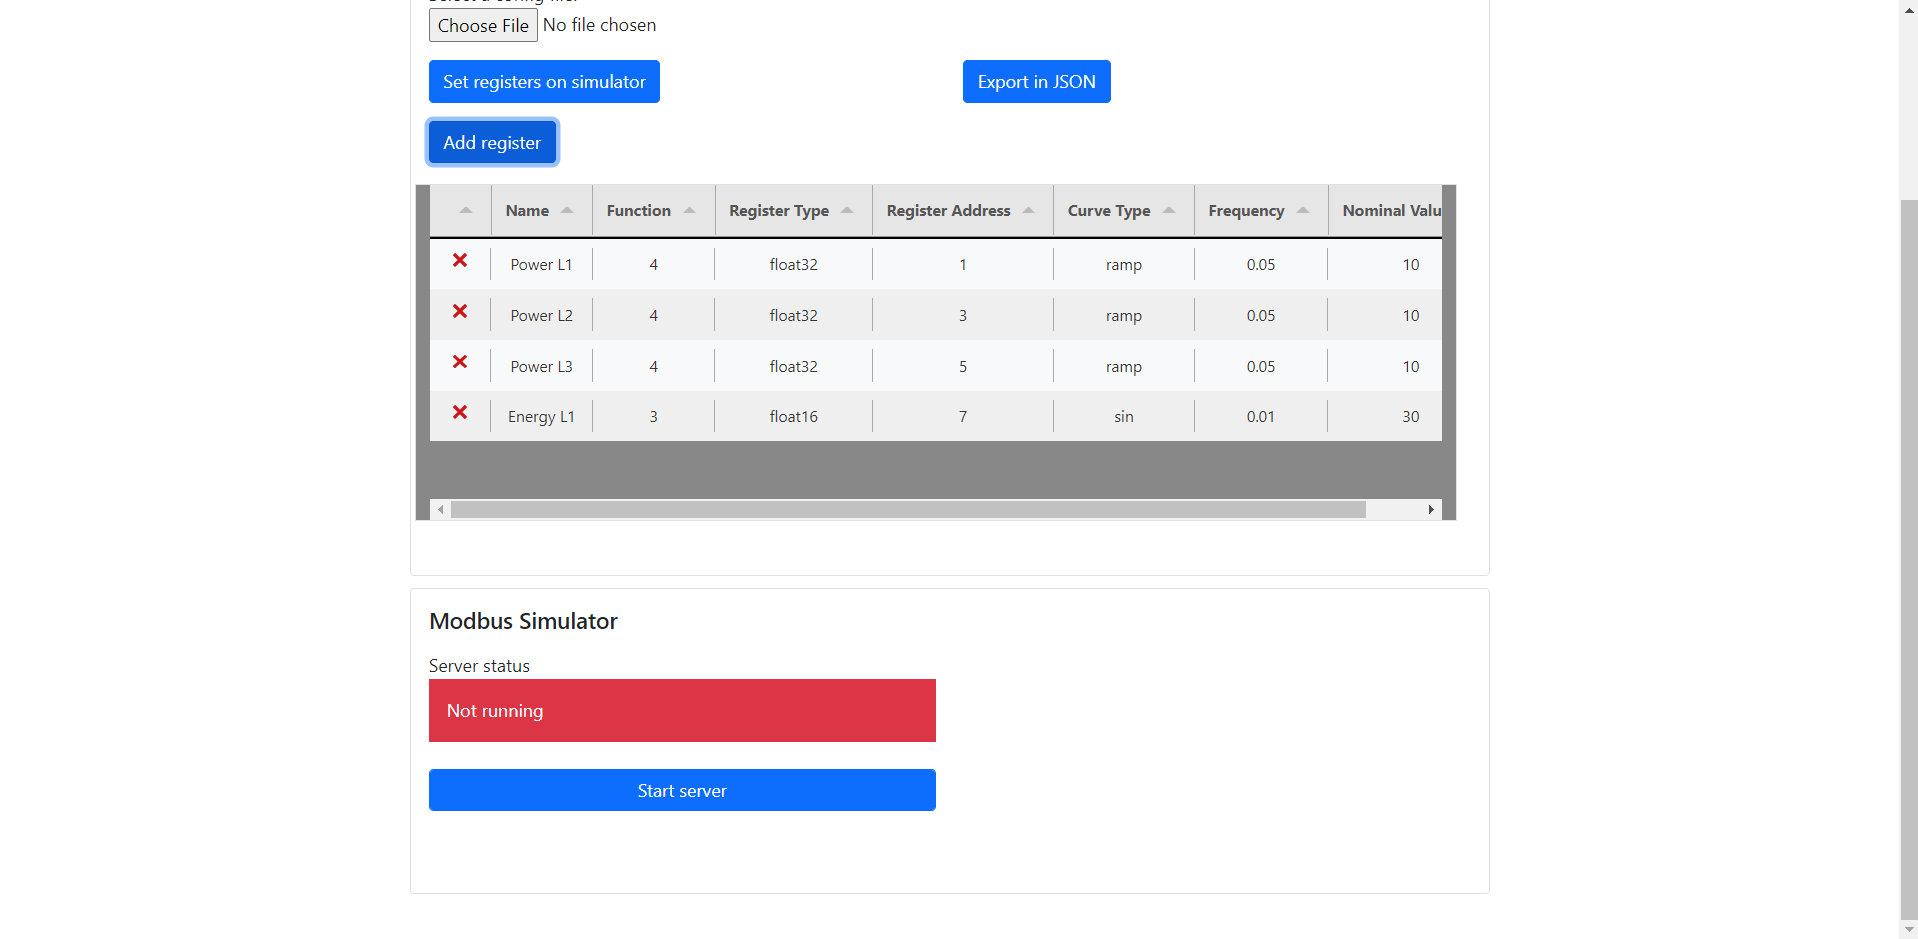
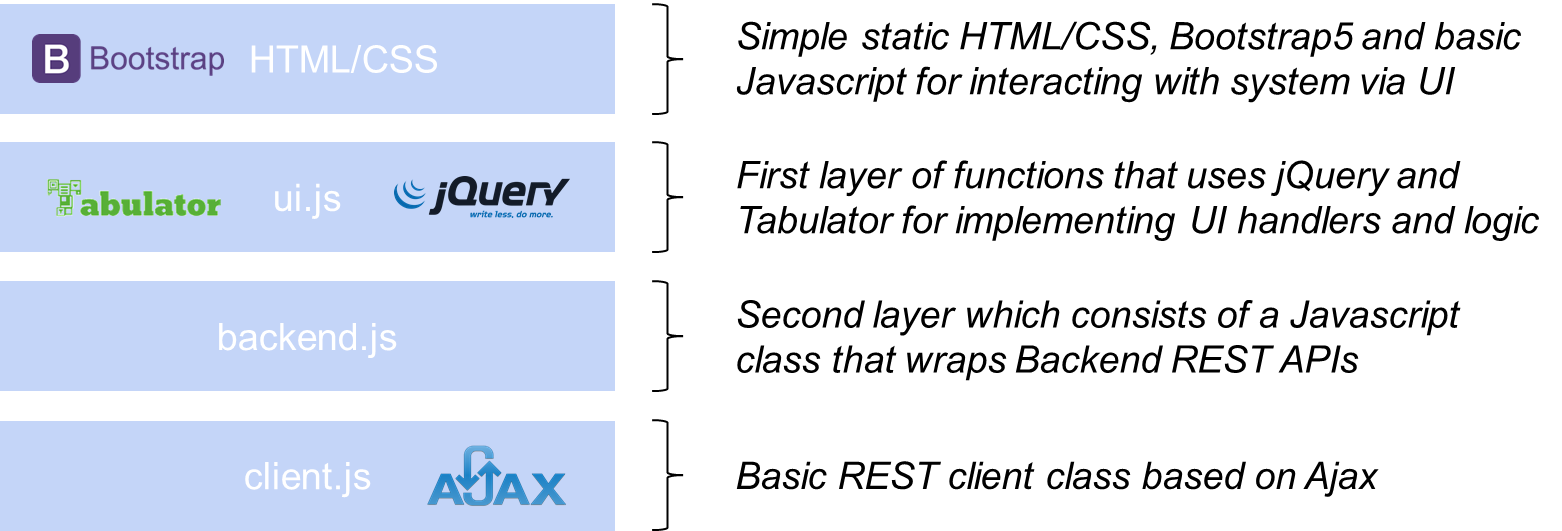
Frontend
The frontend has been designed with simple HTML, CSS (Bootstrap5) and Javascript/jQuery. Here below the image that shows the various stacks of the code.
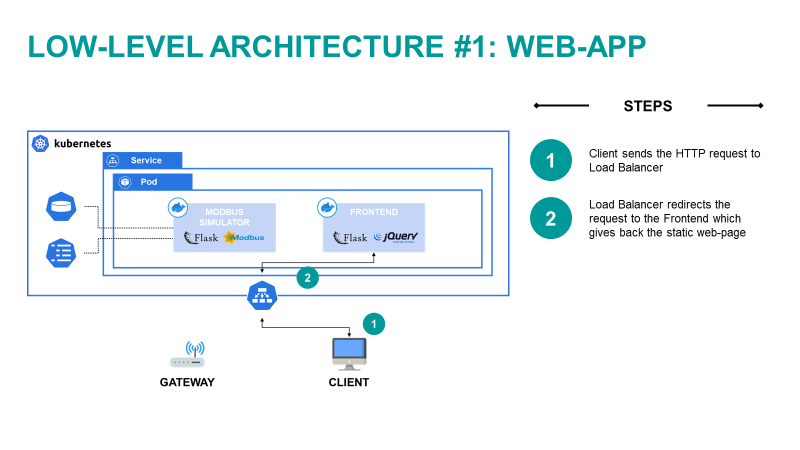
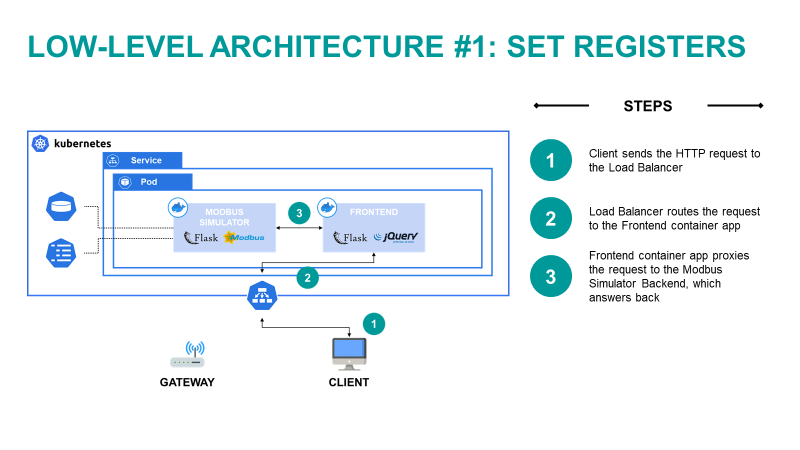
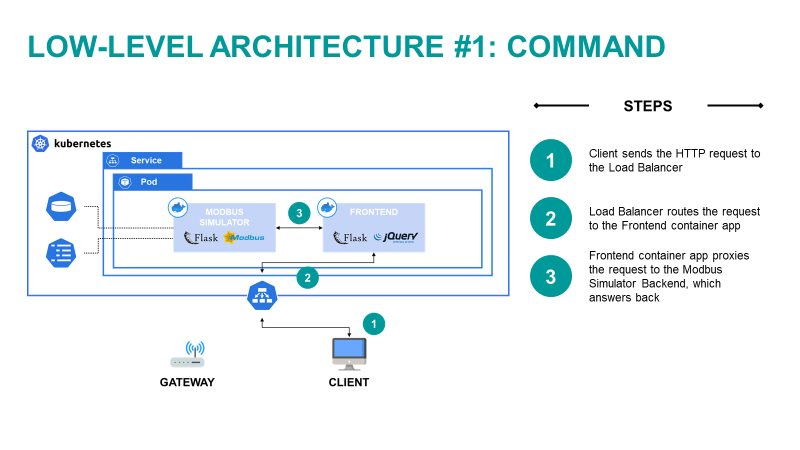
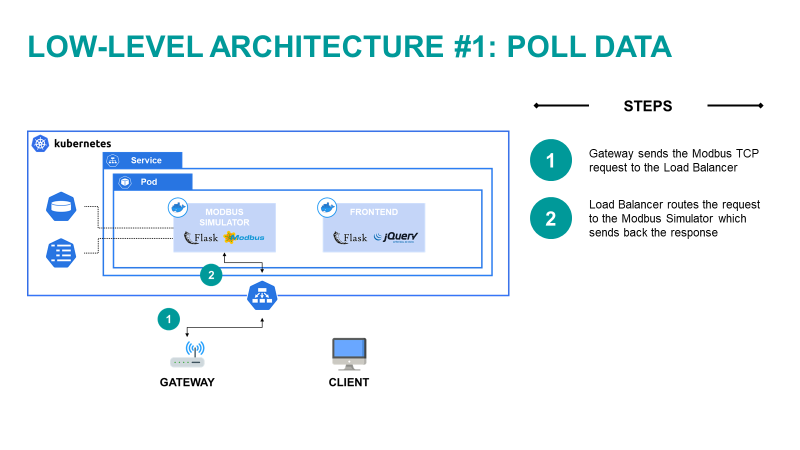
In this section there are the graphical representation and the steps description of the main architectural flows.
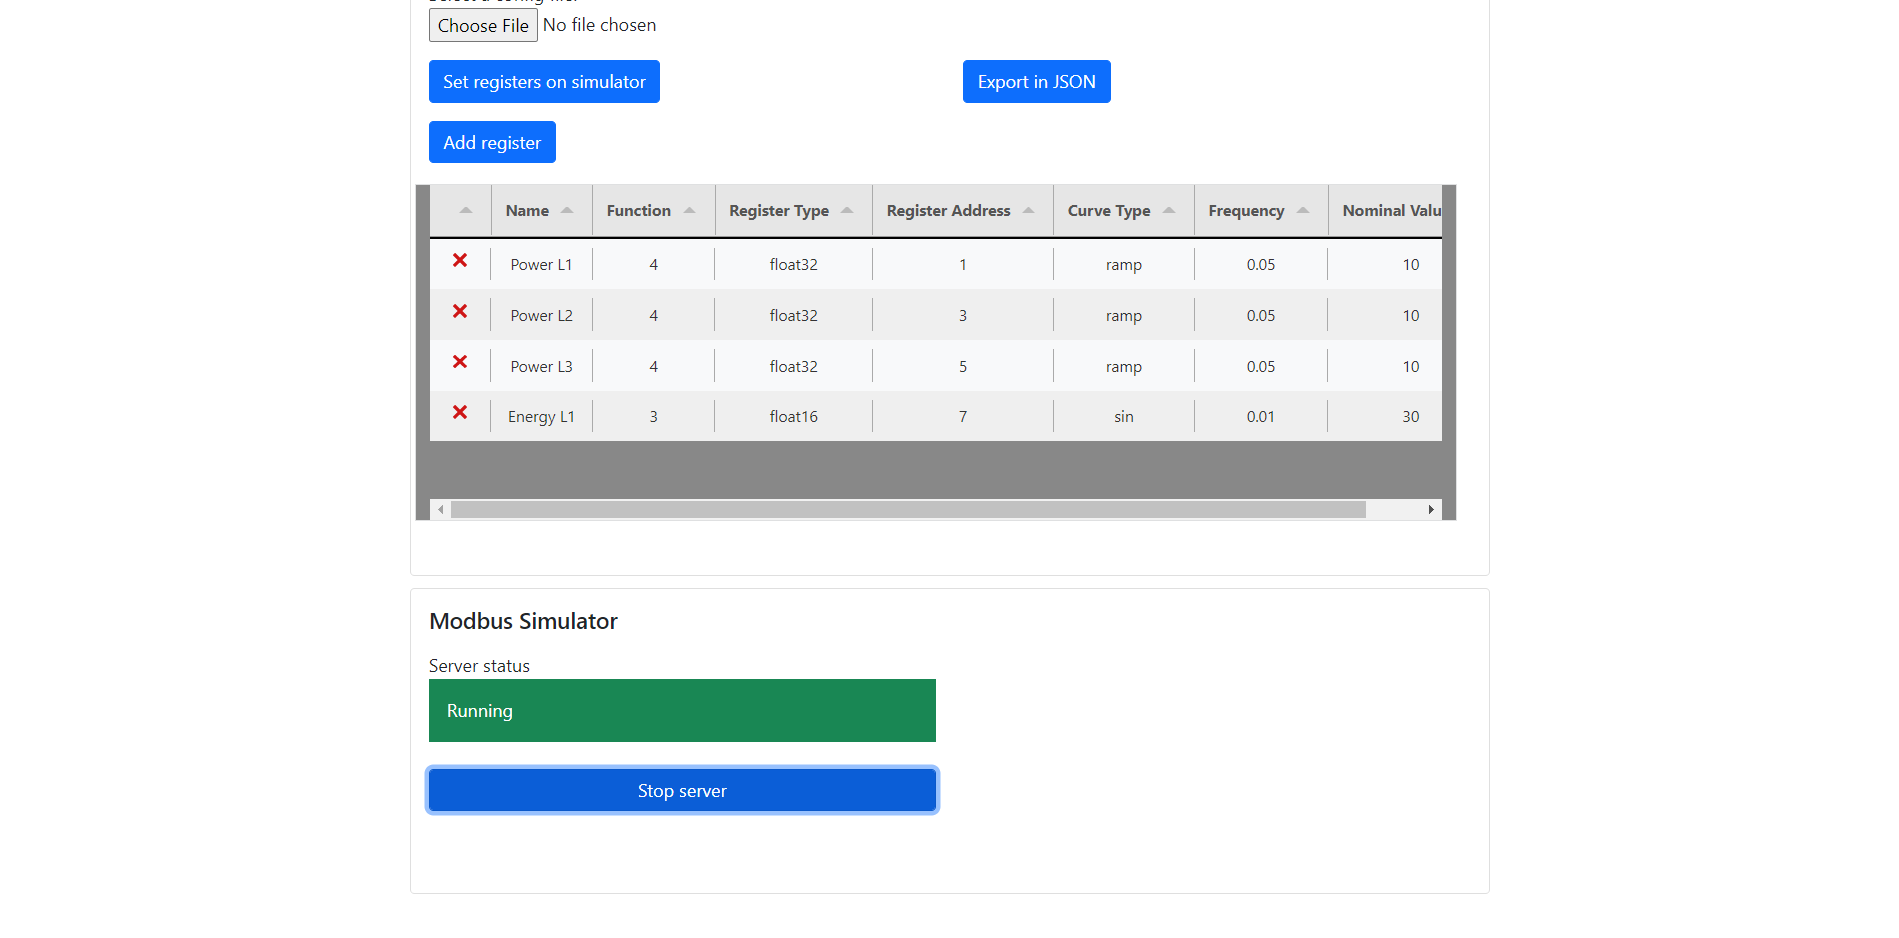
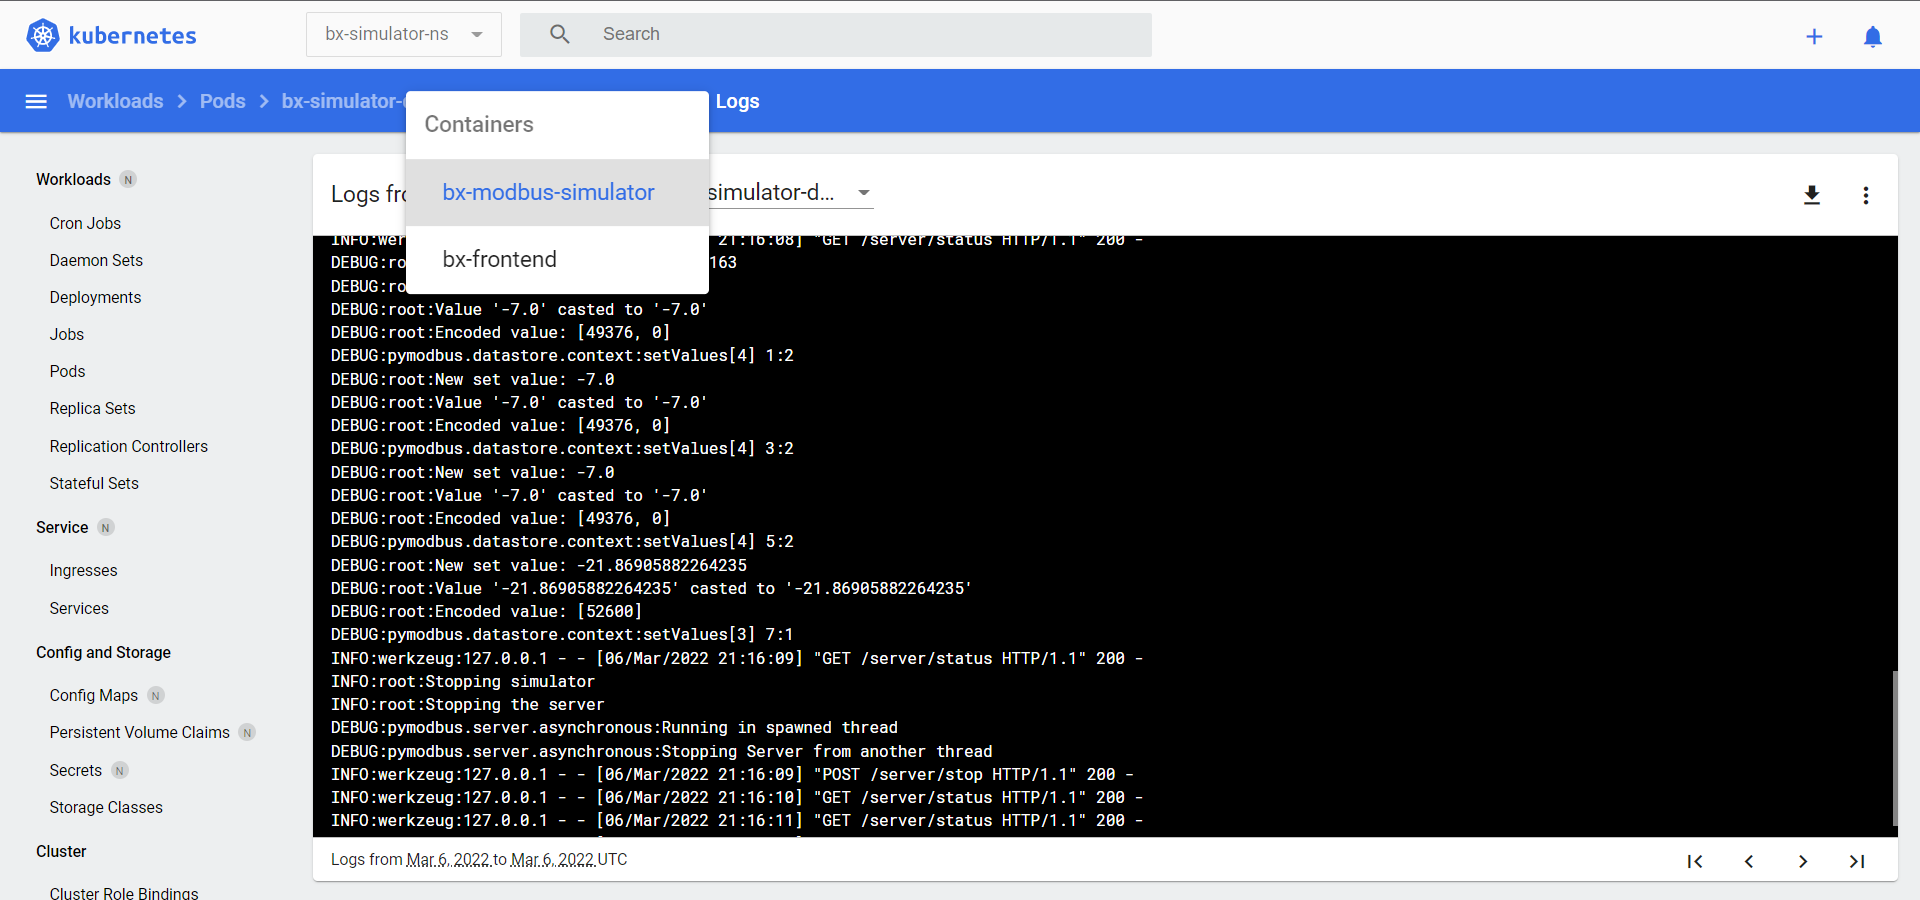
Here below there are the images and video that show the final result obtained with this project.