Home Energy Monitoring
The project consists in the implementation of a Energy Monitoring system for my home. All appliances/loads of the house are powered by electricity, which has a cost that varies in three electricity price bands.
The devices that I used for measuring energy consumption are the TP-Link TAPO P110, which are generally paired with a Mobile App. The limitation I found in such app is that it does not give any insight into the energy consumption, like the use of electricity in the three bands or the share of energy cost for each appliance.
I decided therefore to implement an Energy Monitoring system for my home starting from the TAPO P110 smart plugs with the following goals:
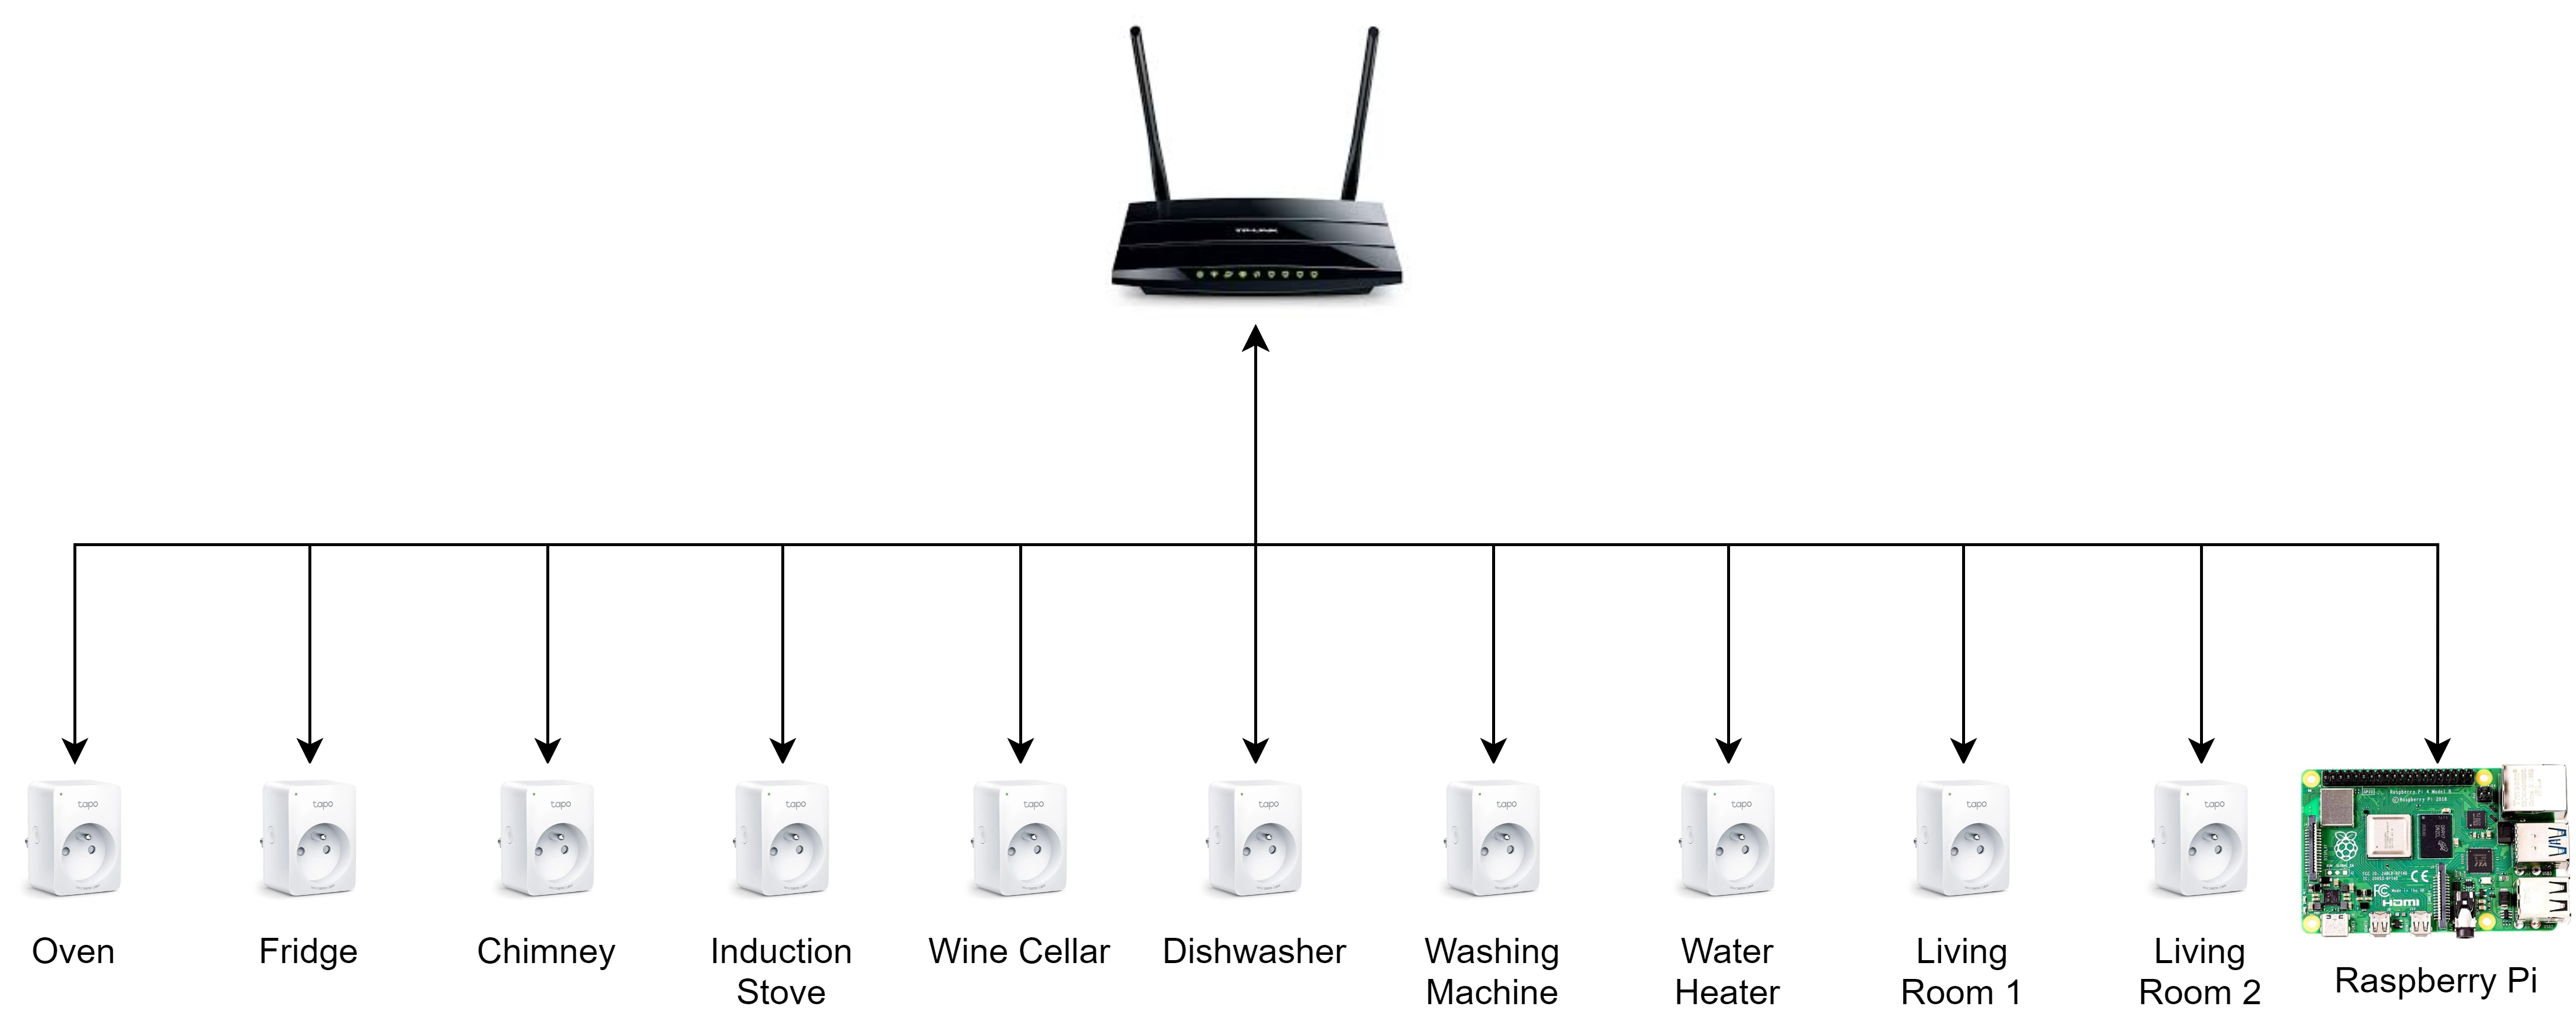
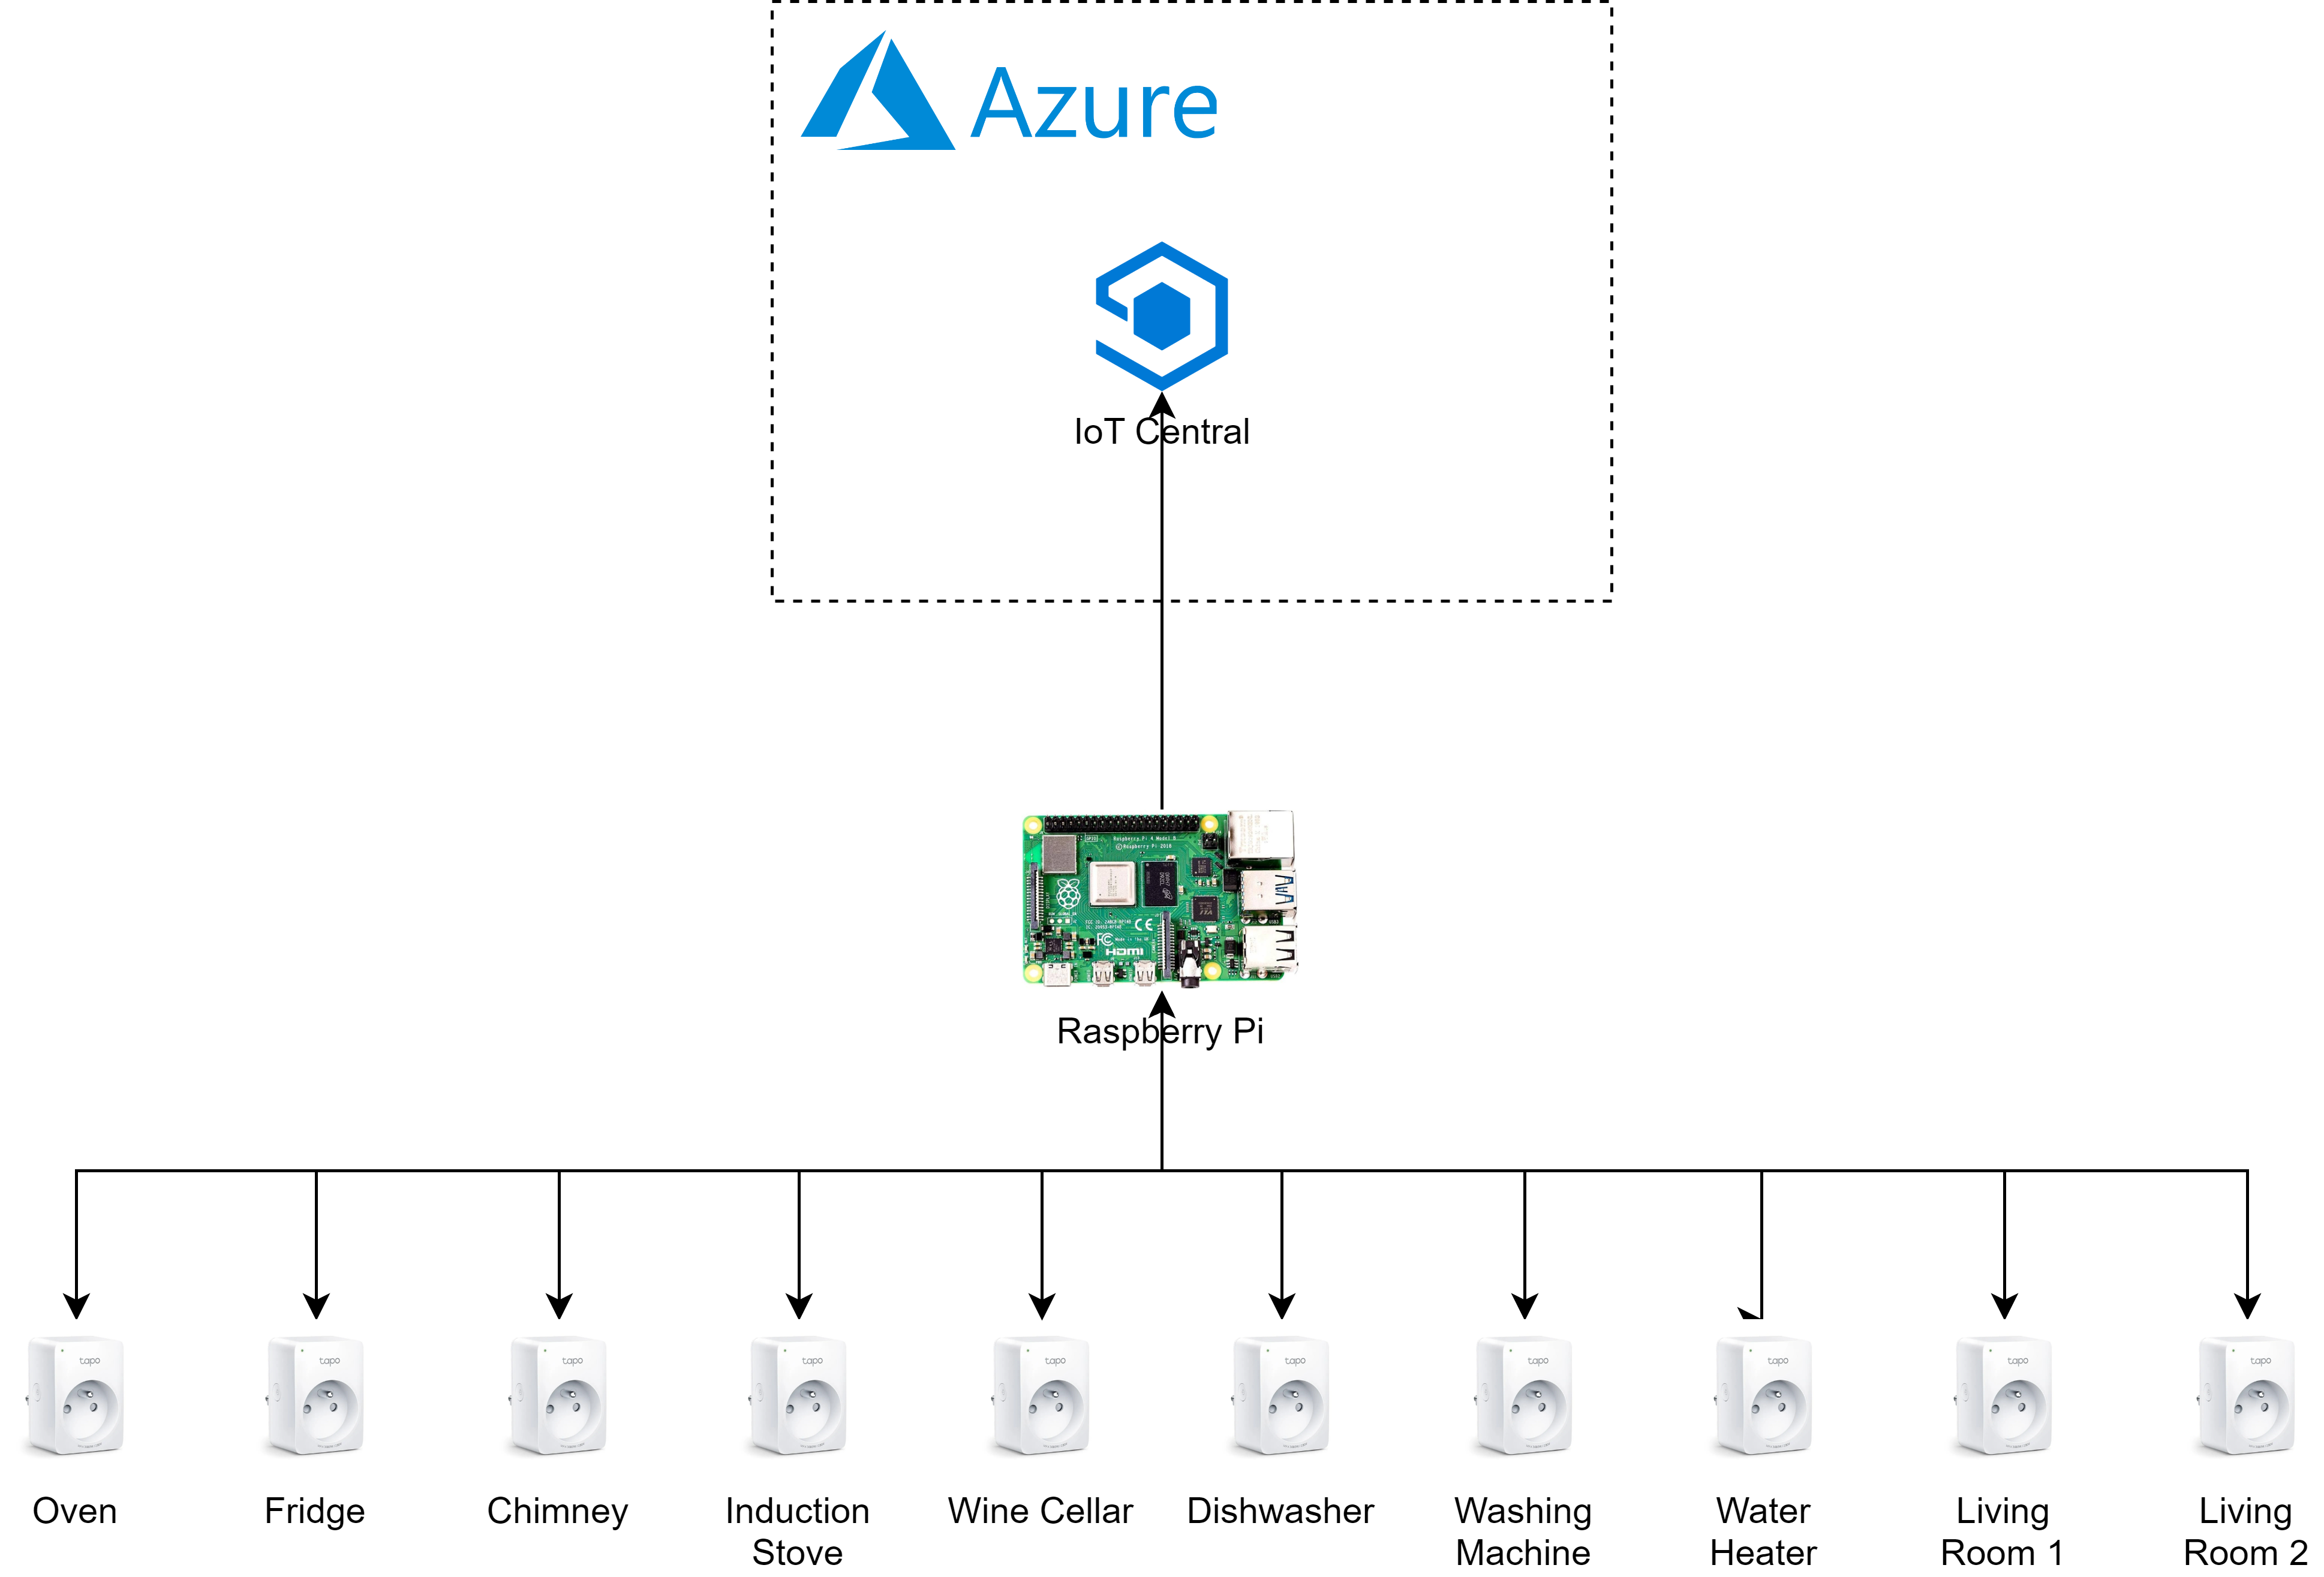
Let’s start with the hardware setup used for the collection of data. As explained above, the core component of the system is the TAPO P110 smart plug, which was used to track all the appliances in the house. In addition to these, obviously there was a Router for internet access and a Raspberry Pi for collecting the data locally via APIs and then sending the data to the cloud.
We can start with an overview of the Edge Software. As the hardware used for the project is a Raspberry Pi 3b+, I decided to develop the software using Docker.
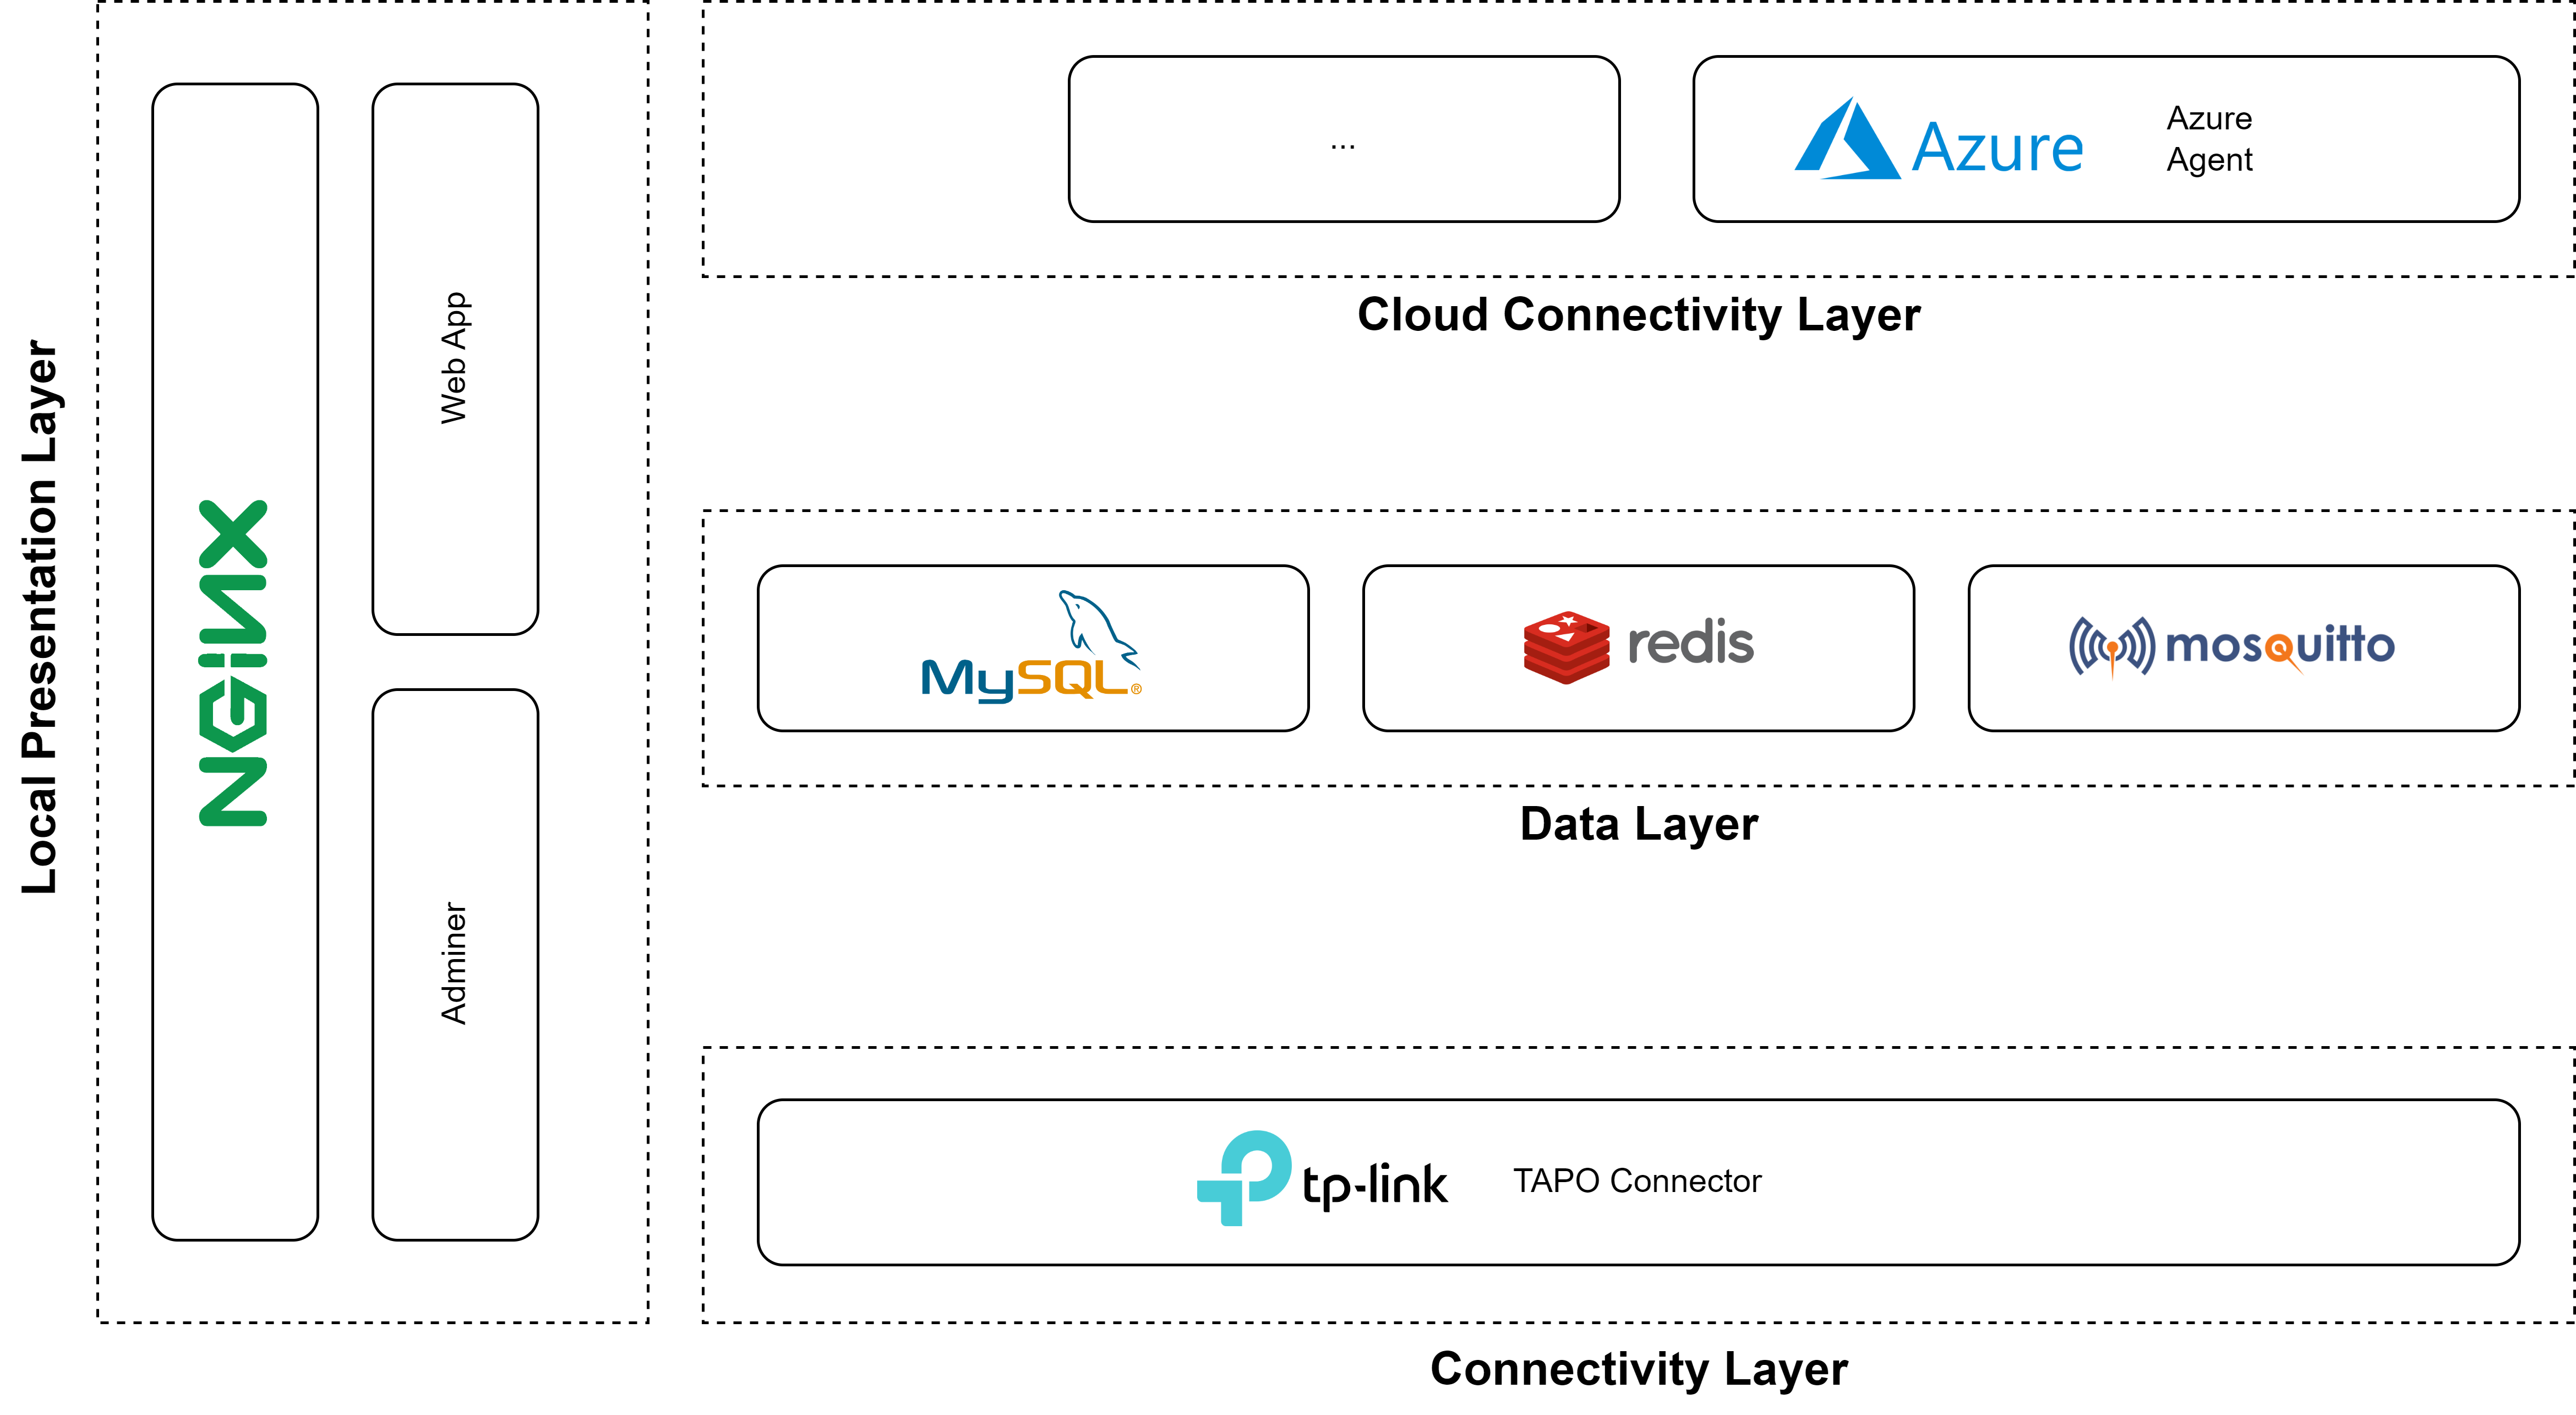
The containers can be clustered across four groups:
Connectivity Layer
The connectivity layer at the moment consists only of the TAPO connector, which implements the following functionalities:
Data Layer
The data layer includes the following containers:
Cloud Connectivity Layer
This layer is responsible for sending data to the Cloud Provider of choice. As explained, for this project the Cloud Provider is Azure so there is only the Azure Agent which implements the following functionalities:
Local Presentation Layer
There was the need to allow the configuration of the software locally, like for example:
Cloud Architecture
As one of the two project goals, the selected Cloud Provider is Azure and especially the initial idea was to try out IoT Central. IoT Central is a ready-made UX and API offering that allows to rapidly connect devices to the cloud and visualise data in a dashboard.
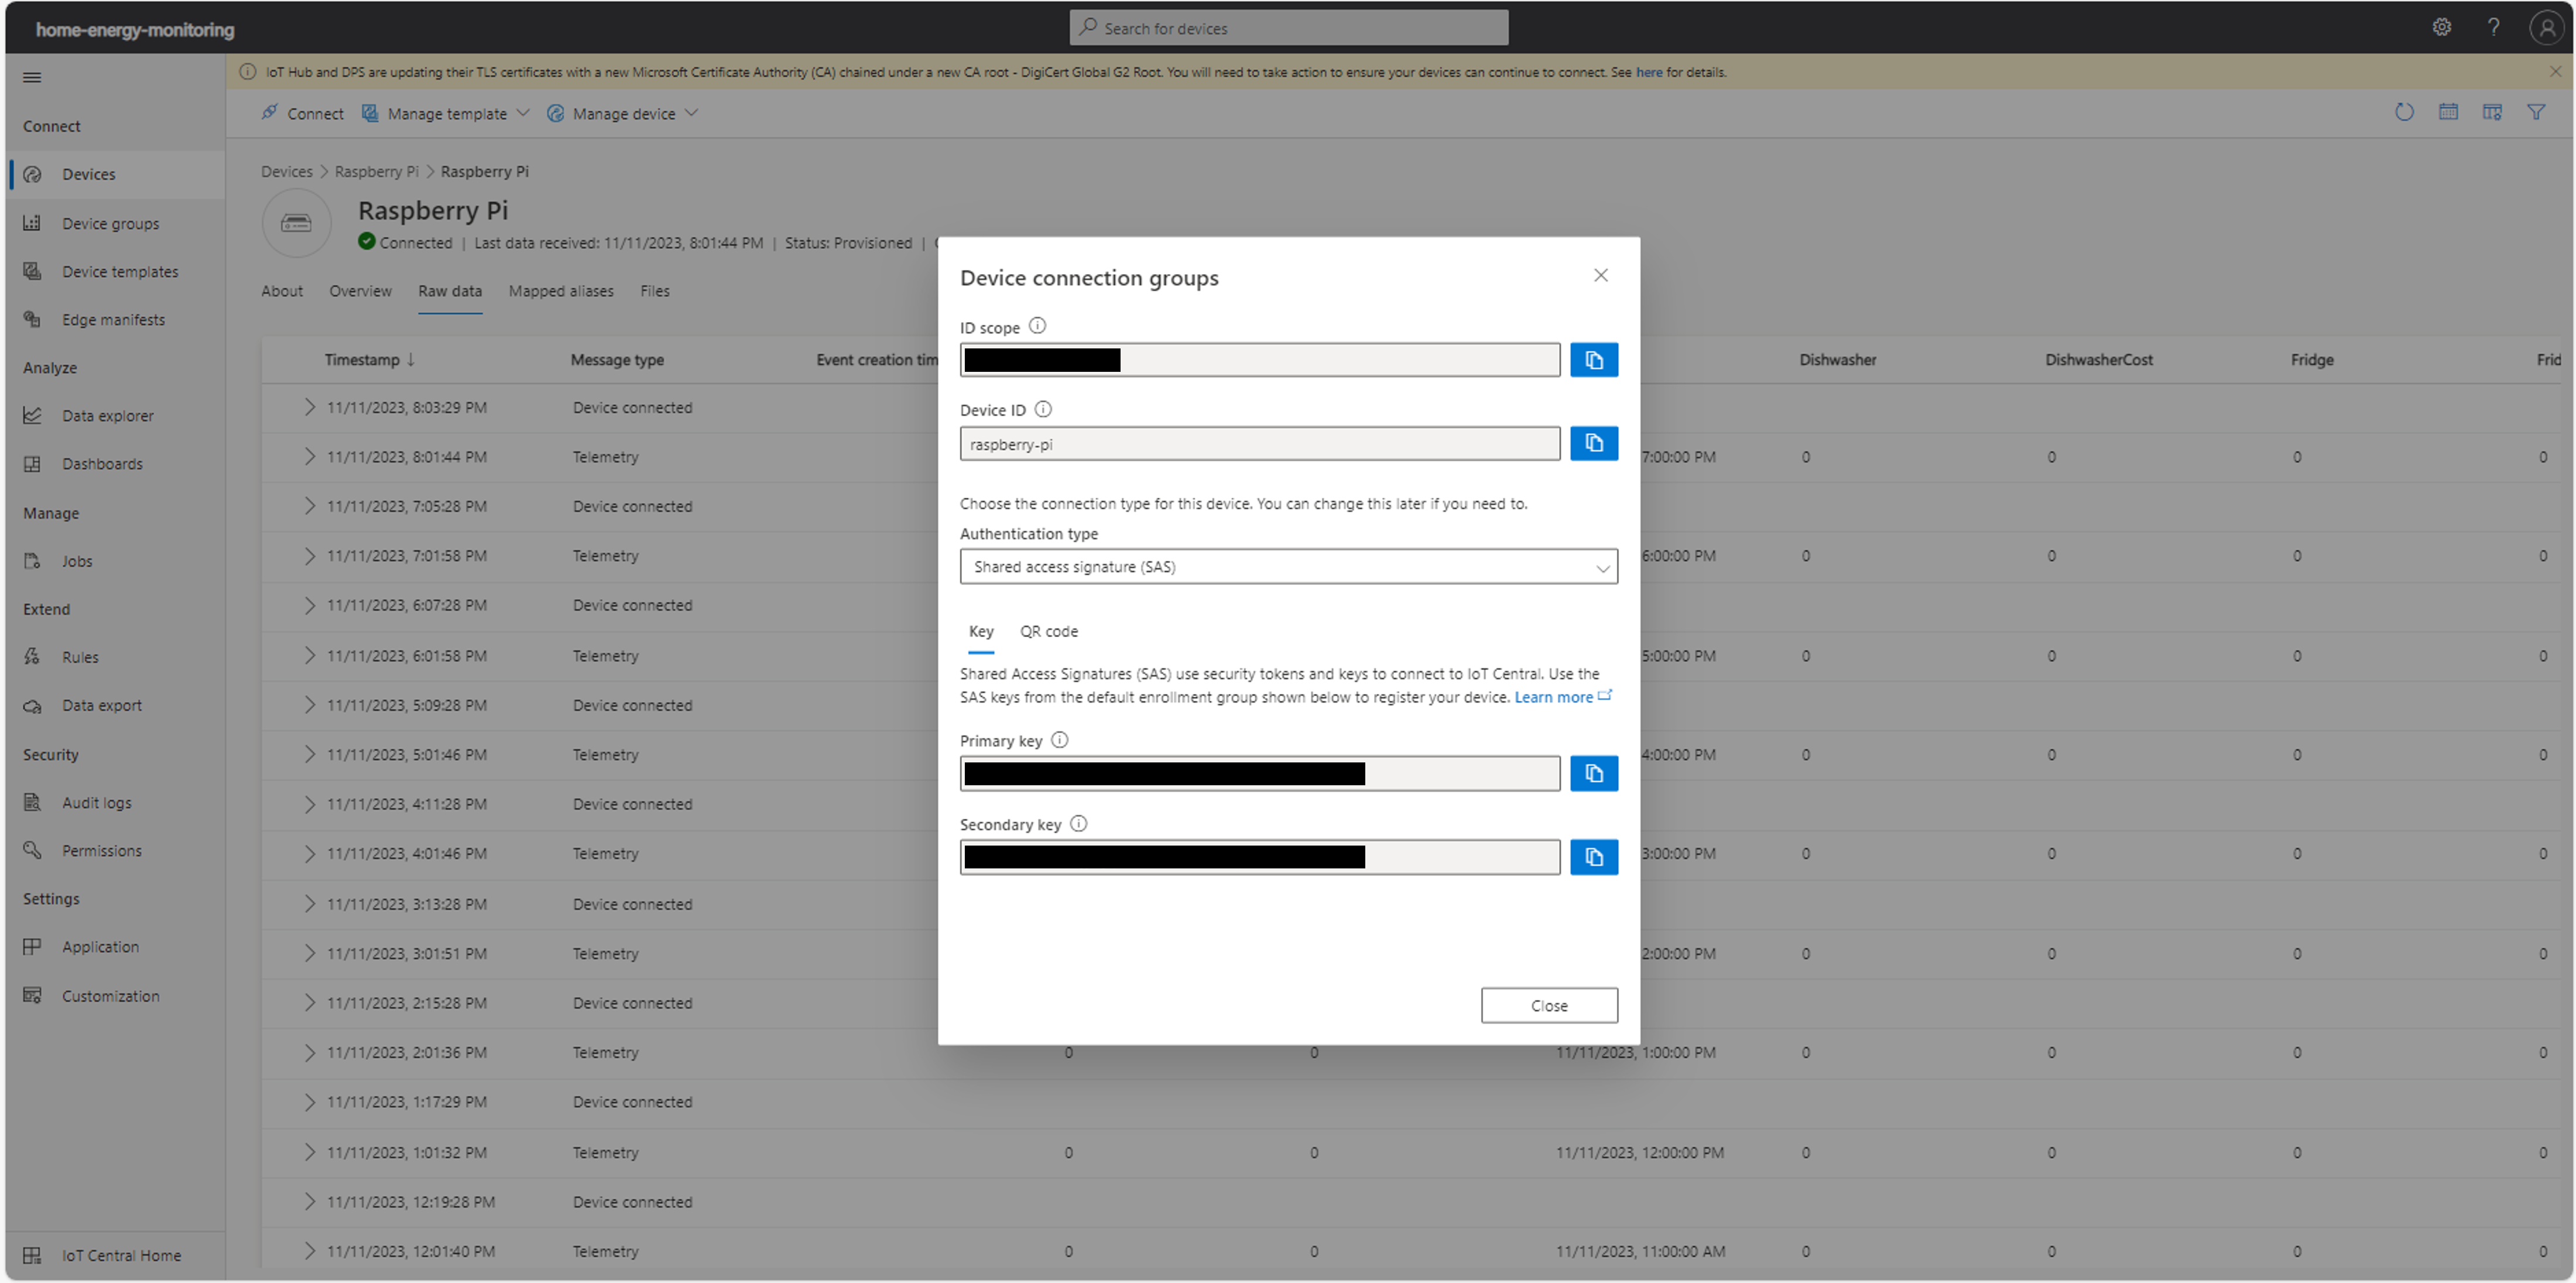
IoT Central allows a fast connection of any device (a Raspberry Pi in this case) via the Azure IoT Hub and quick monitoring of the ongoing traffic. Data is processed by using a device templace, which is either provided by the user or can be created by using the recommendation feature which automatically deduces the template by looking at received data.Below a screenshot of the service.
Cloud Architecture v2
As I started consuming and configuring the IoT Central, I ran into some limitations:
- Data storage is ensured for a month, after which data is deleted;
- It’s possible to create device templates for reading out data coming from the field, but data model cannot be too complicated (e.g. nesting);
- Limits in the data visualisation of the dashboard.
For what concerns point 2, I simply flattened the telemetry message.For data lifecycle policy, instead, there was no solution other than updating the architecture.Also, I decided to add some aggregation functionality by house area (e.g. Kitchen).
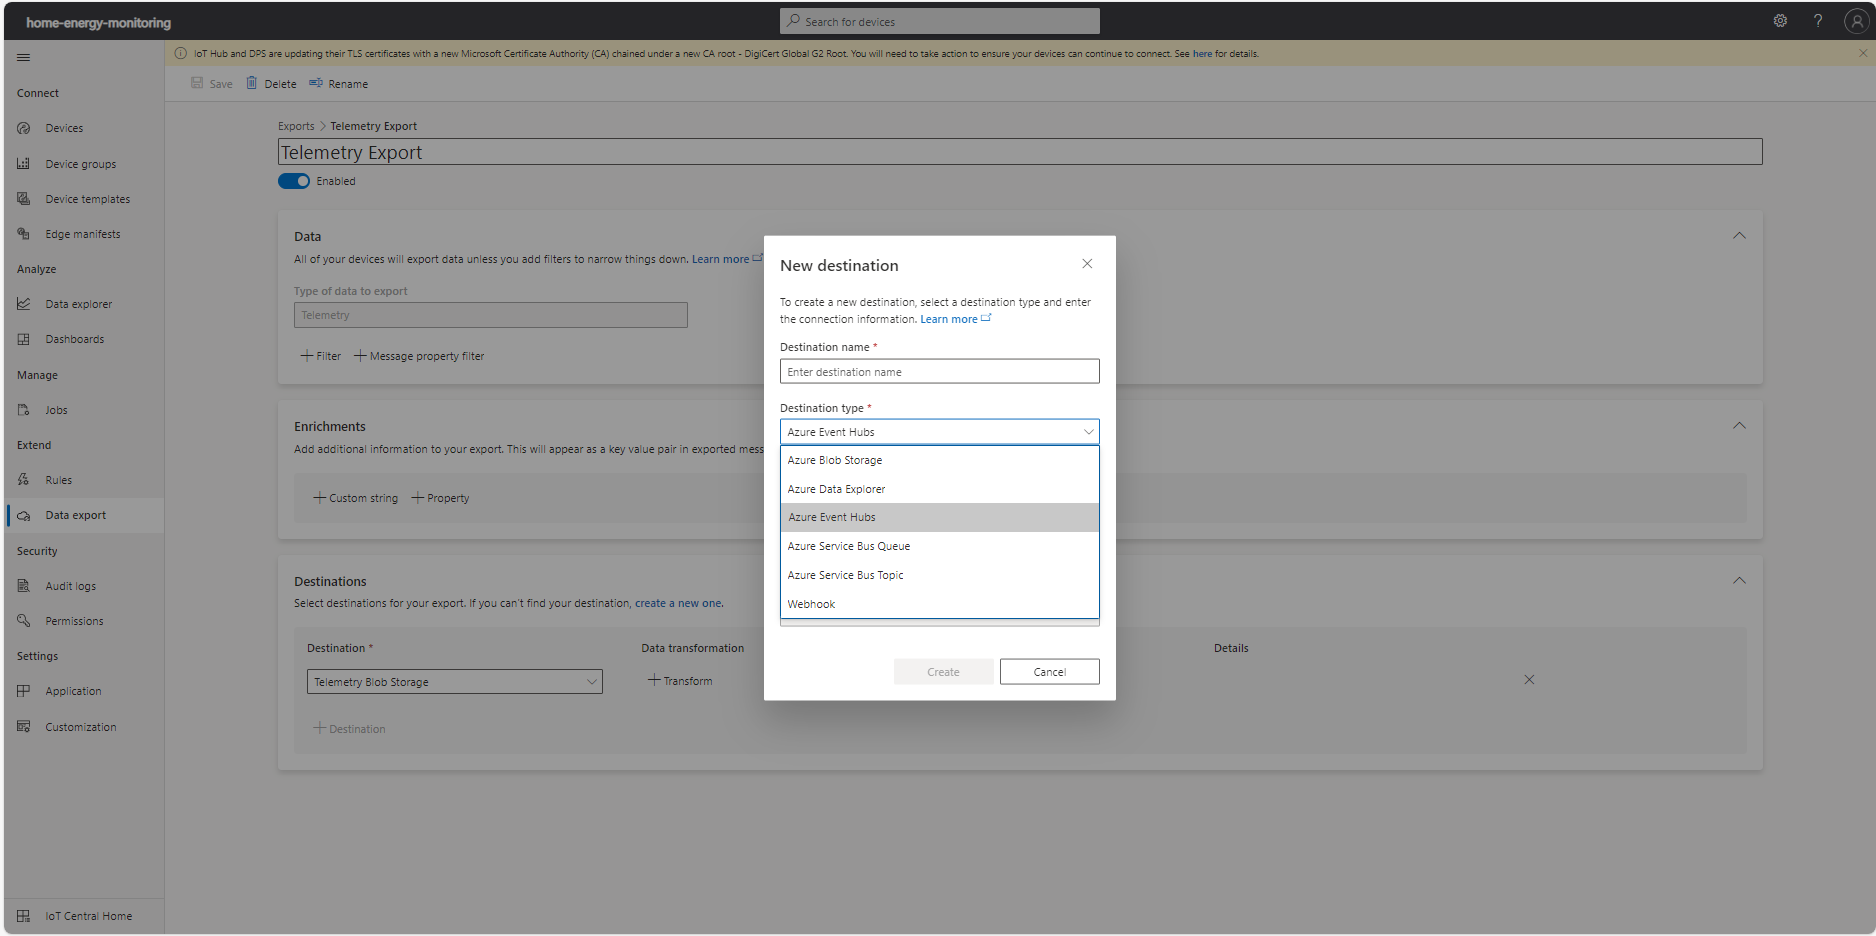
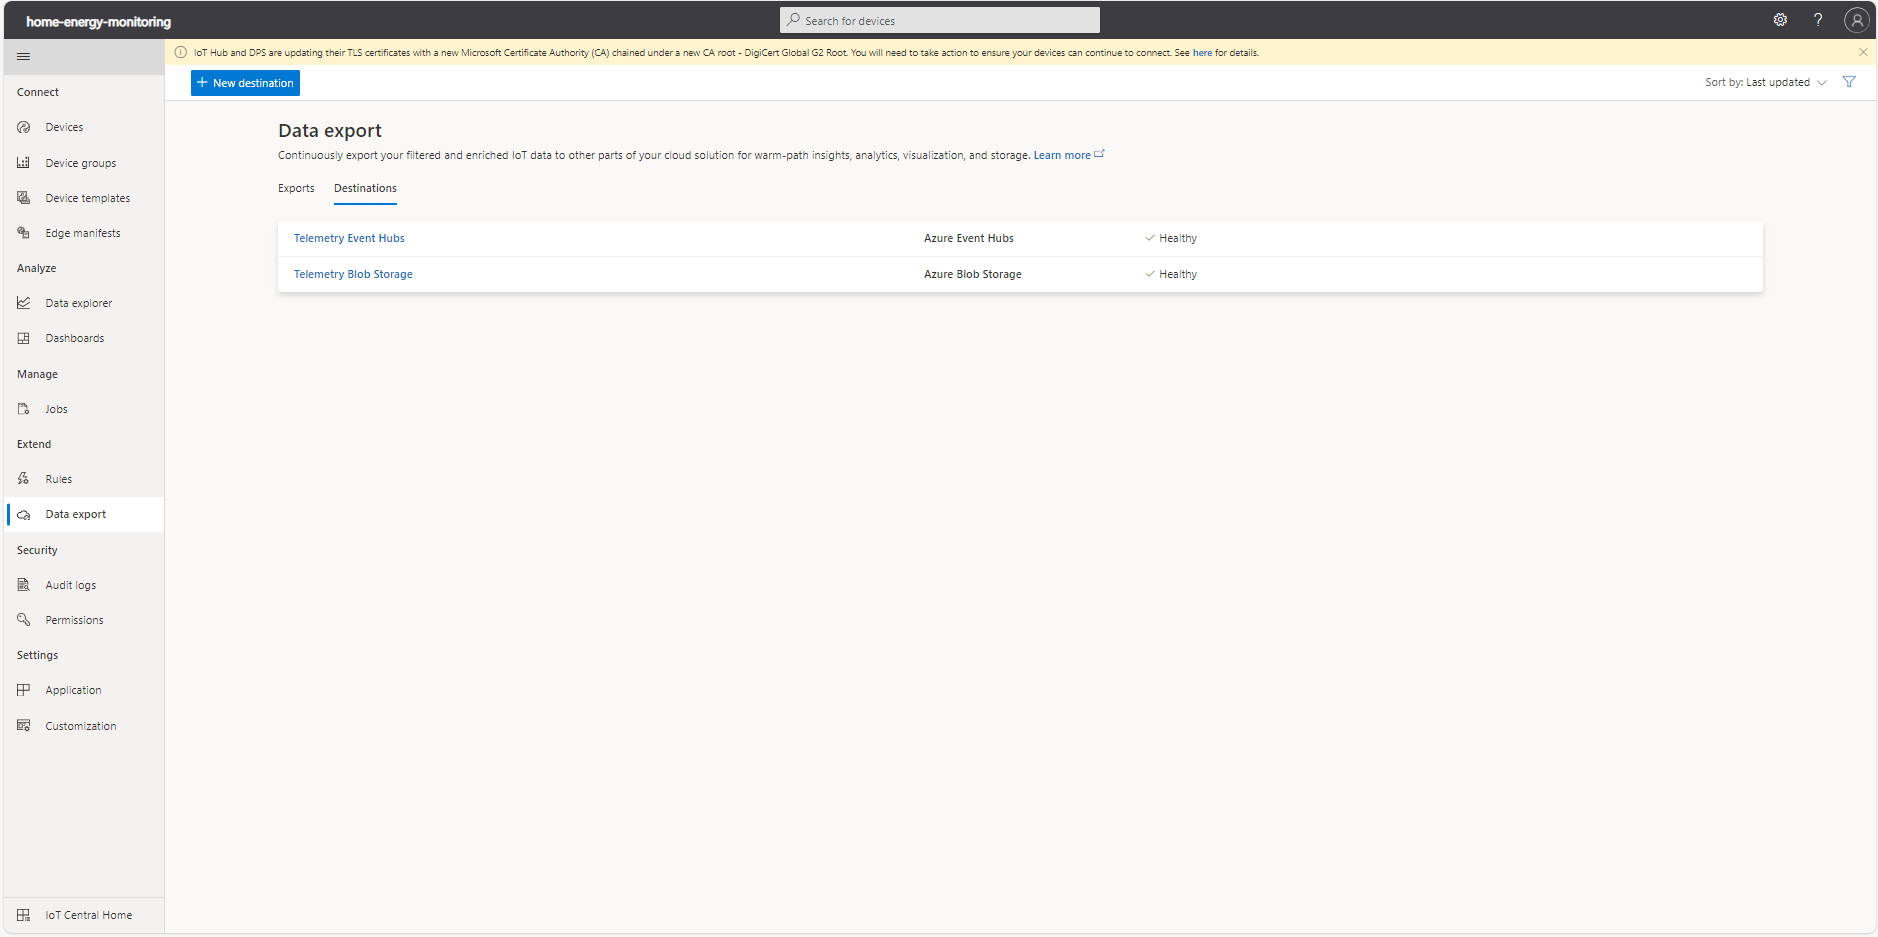
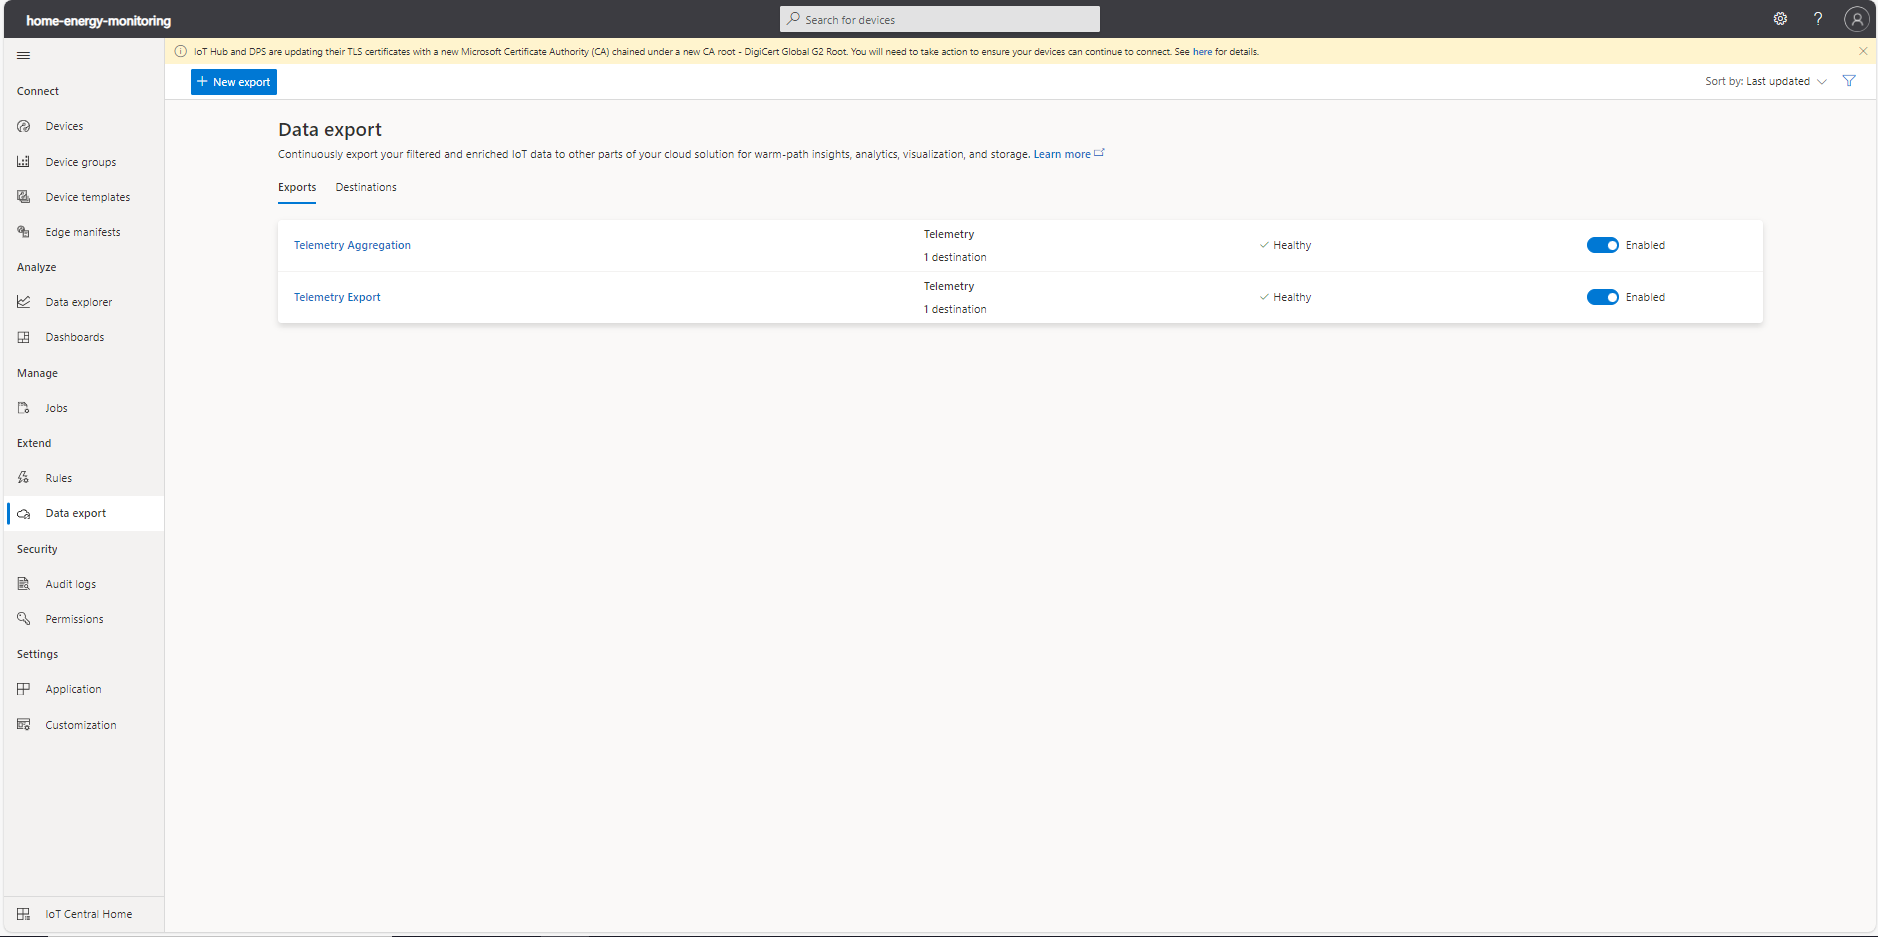
There are several options supported in Azure IoT Central for exporting data:
Below the updated version of the architecture for the Home Energy Monitoring:
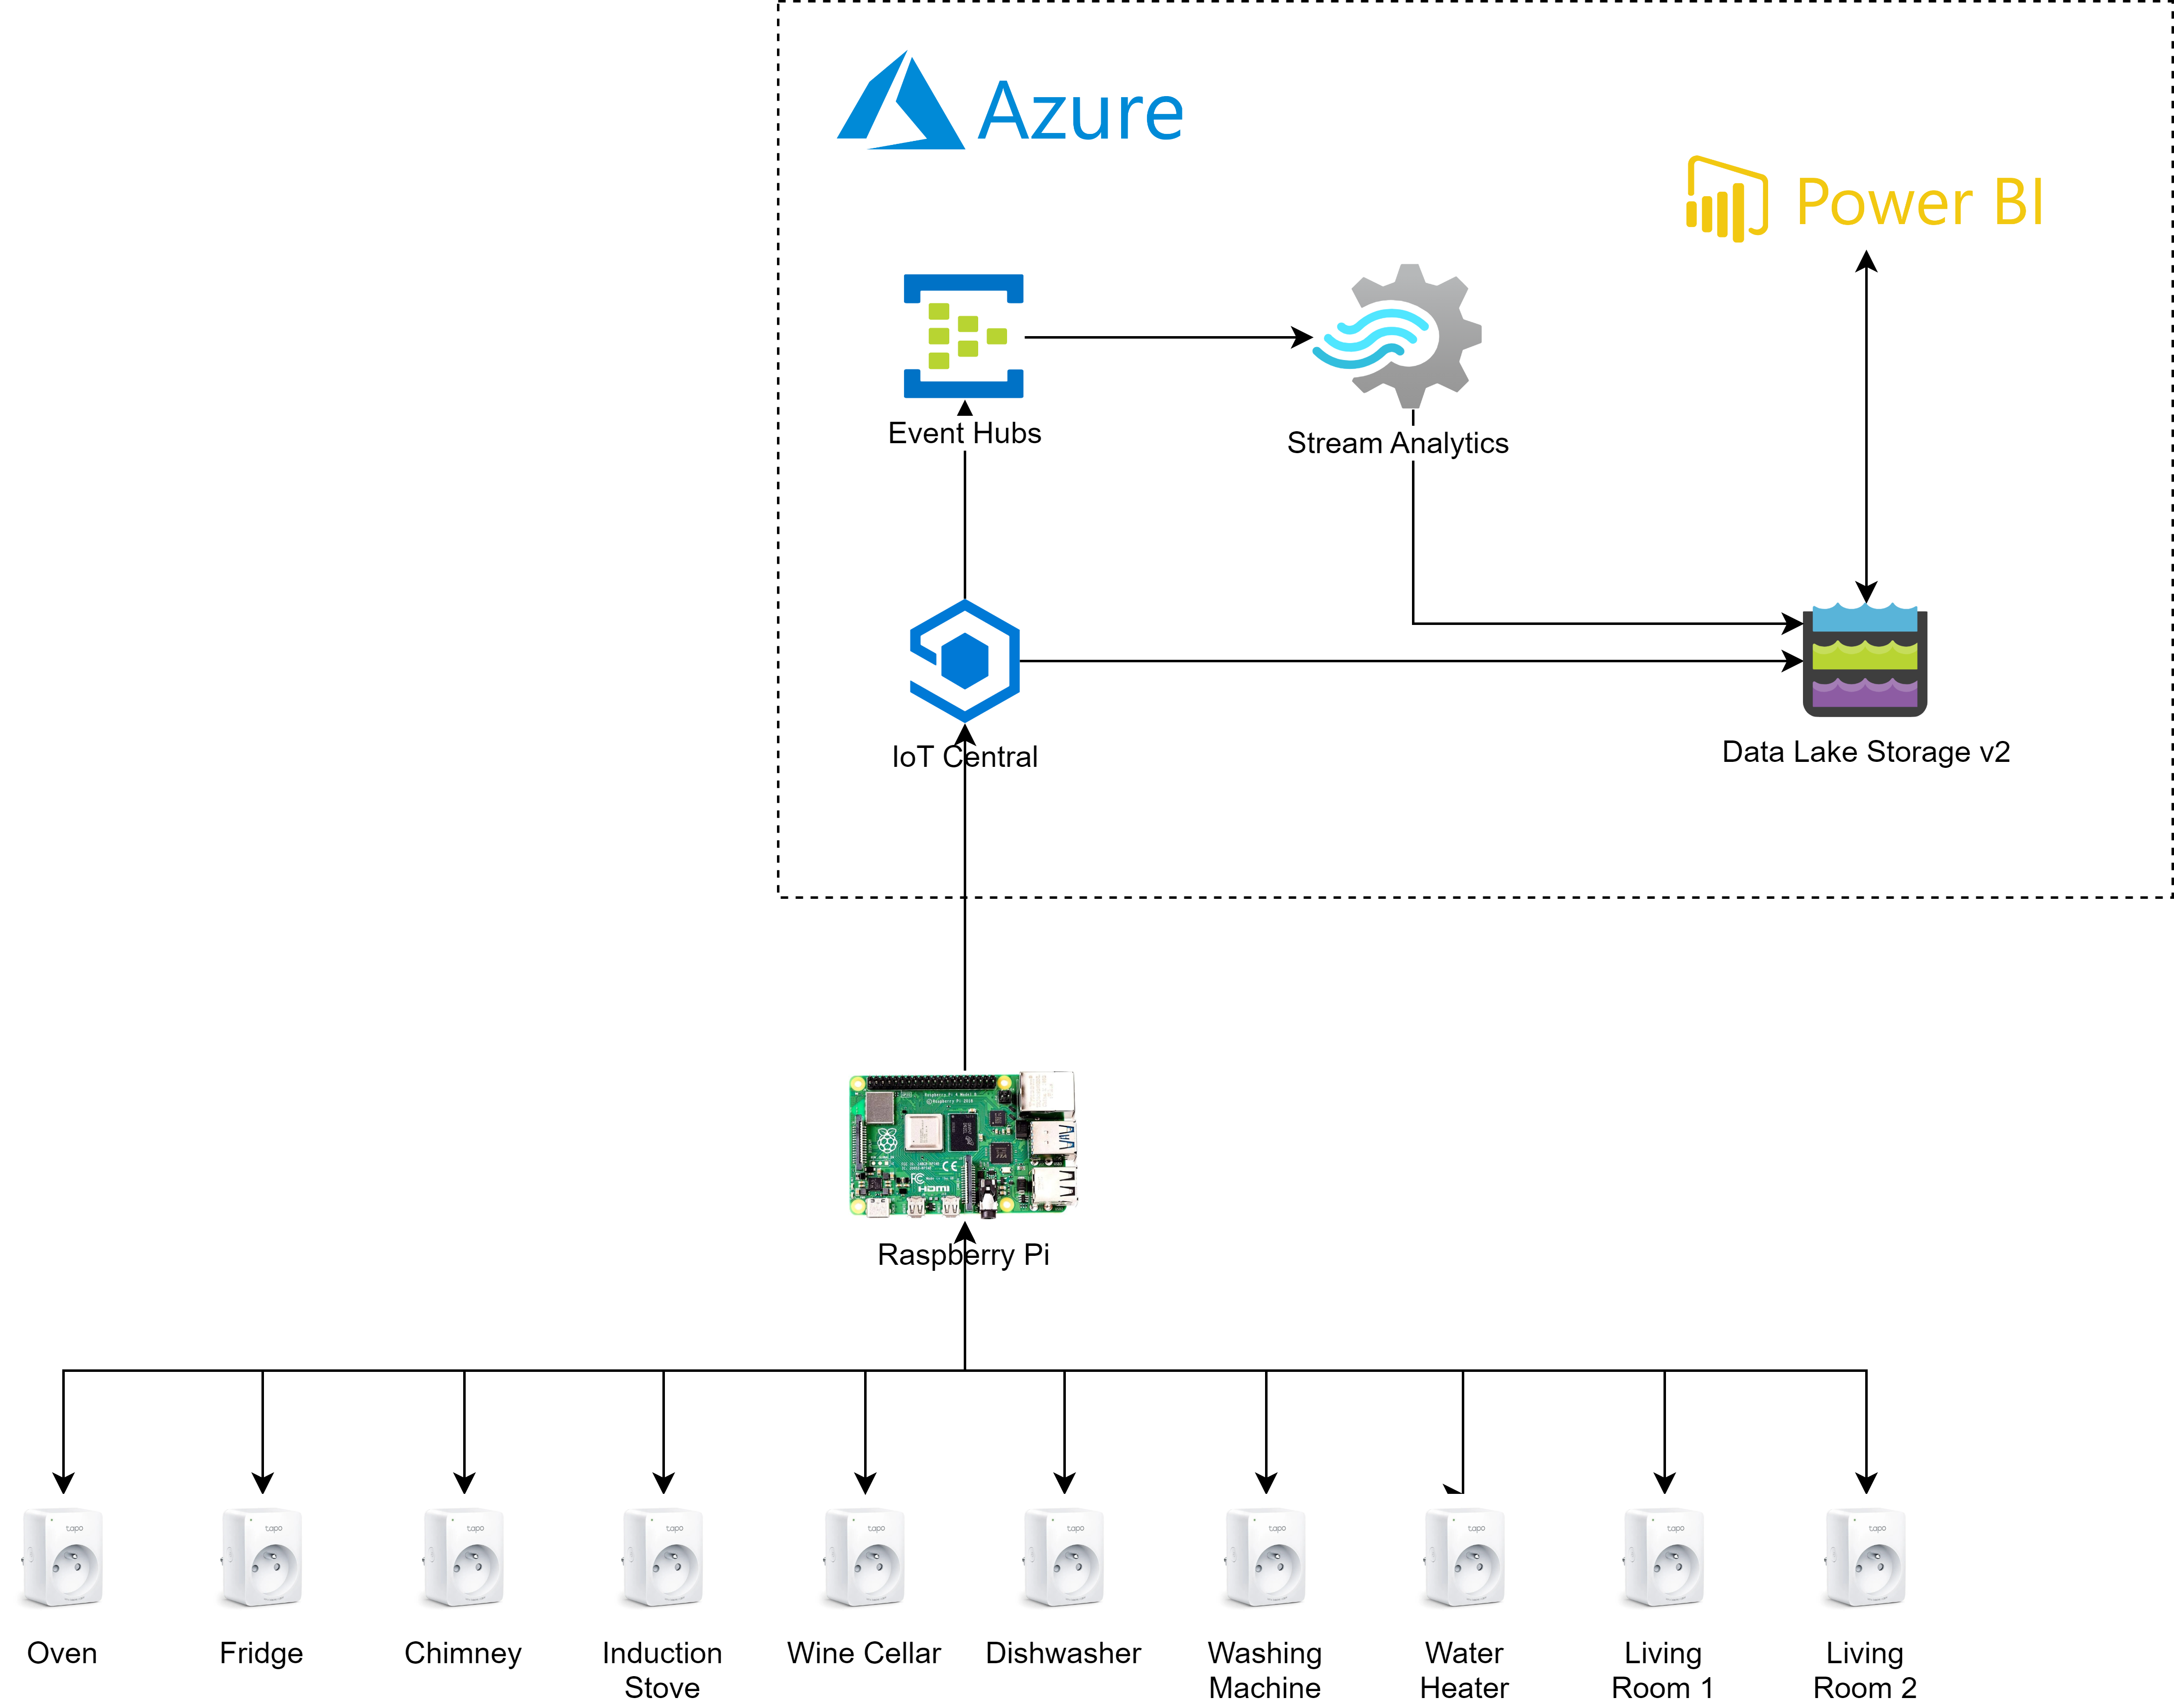
The result of the data export to ADLSv2 is a hierarchical set of folders that comprises the year, month, day, hour and minute when the data was received. Inside the last of the folders (i.e. minute), IoT Central stores a JSON file with the received telemetry packages.
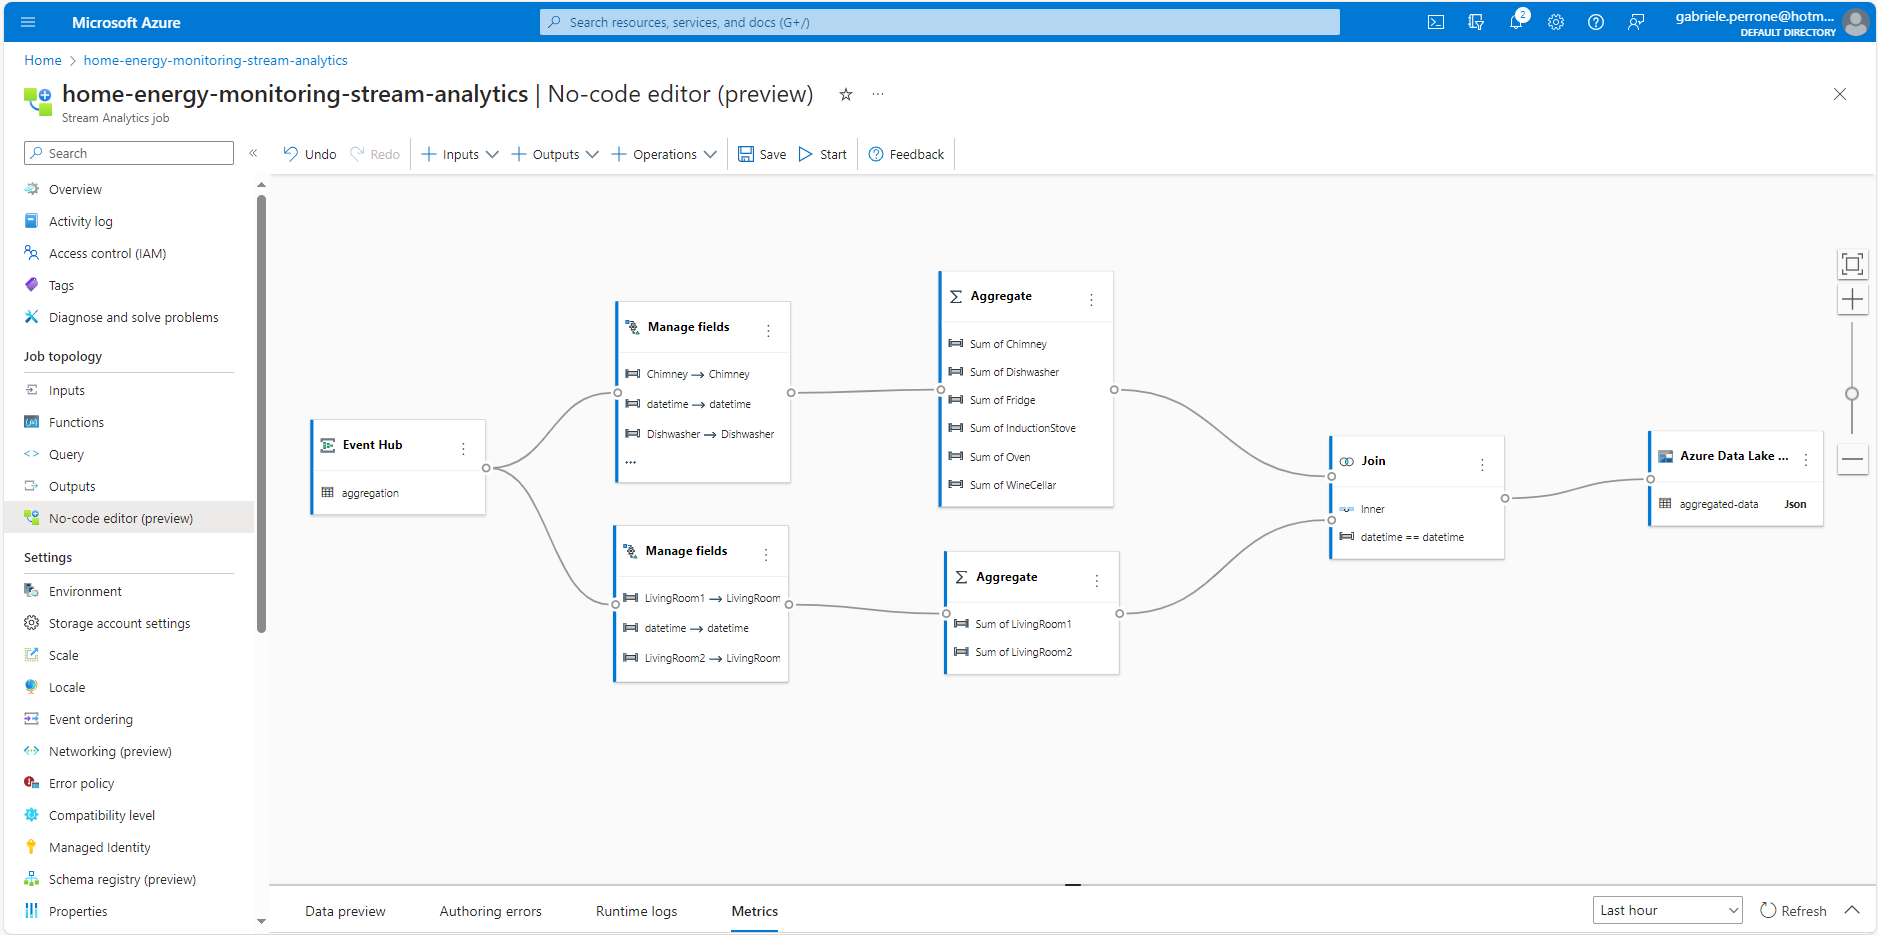
For what concerns instead the streaming solution, Azure Stream Analytics offers two options: query or no-code environment. I leveraged the no-code environment for implementing some simple aggregation by area, like kitchen, living room, etc.
Here below some sample that shows the results.
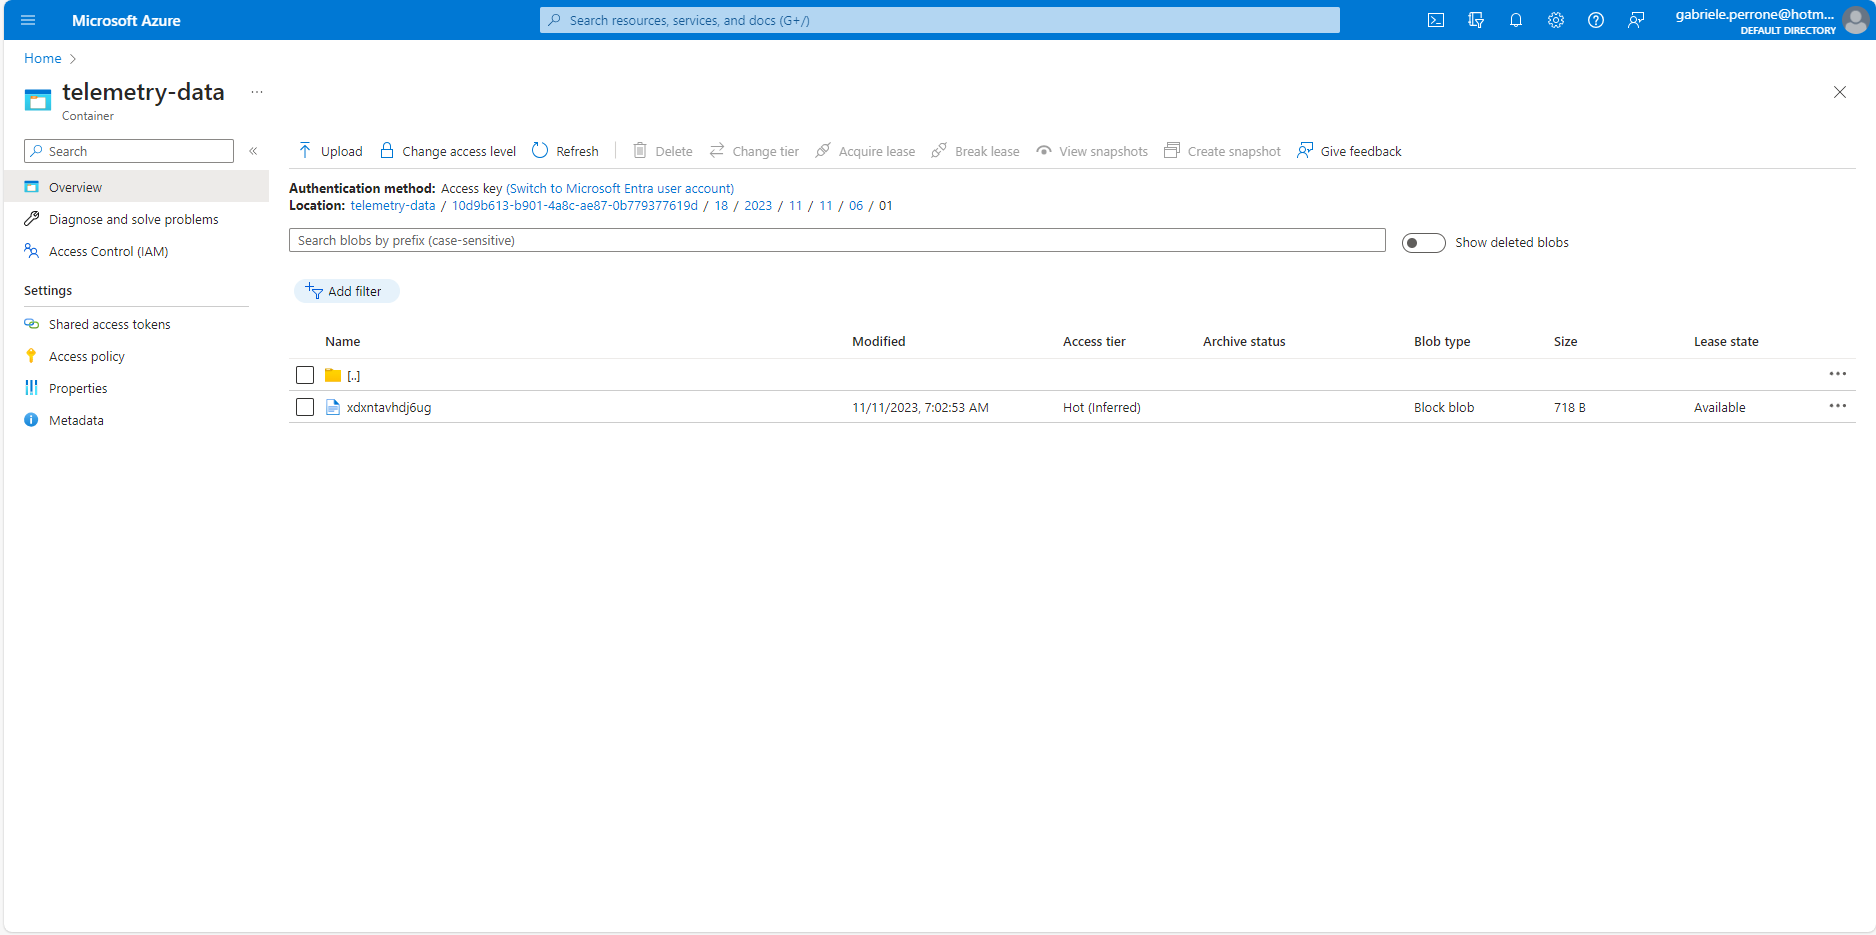
Example of Blob export.
In this section there are some results divided by system component.
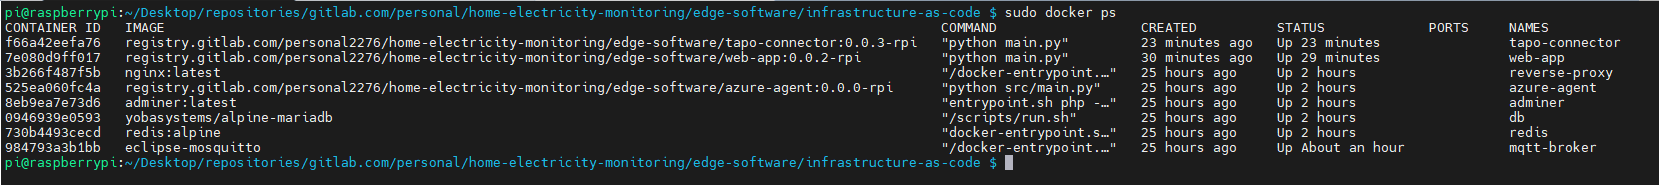
Edge Software
Here below the screenshot of the Docker containers running on the Raspberry Pi. In particular, MySQL image had to be changed because there was no compatible image for linux/arm/v7 architecture. The alternative MariaDB was chosen with no change to code required.
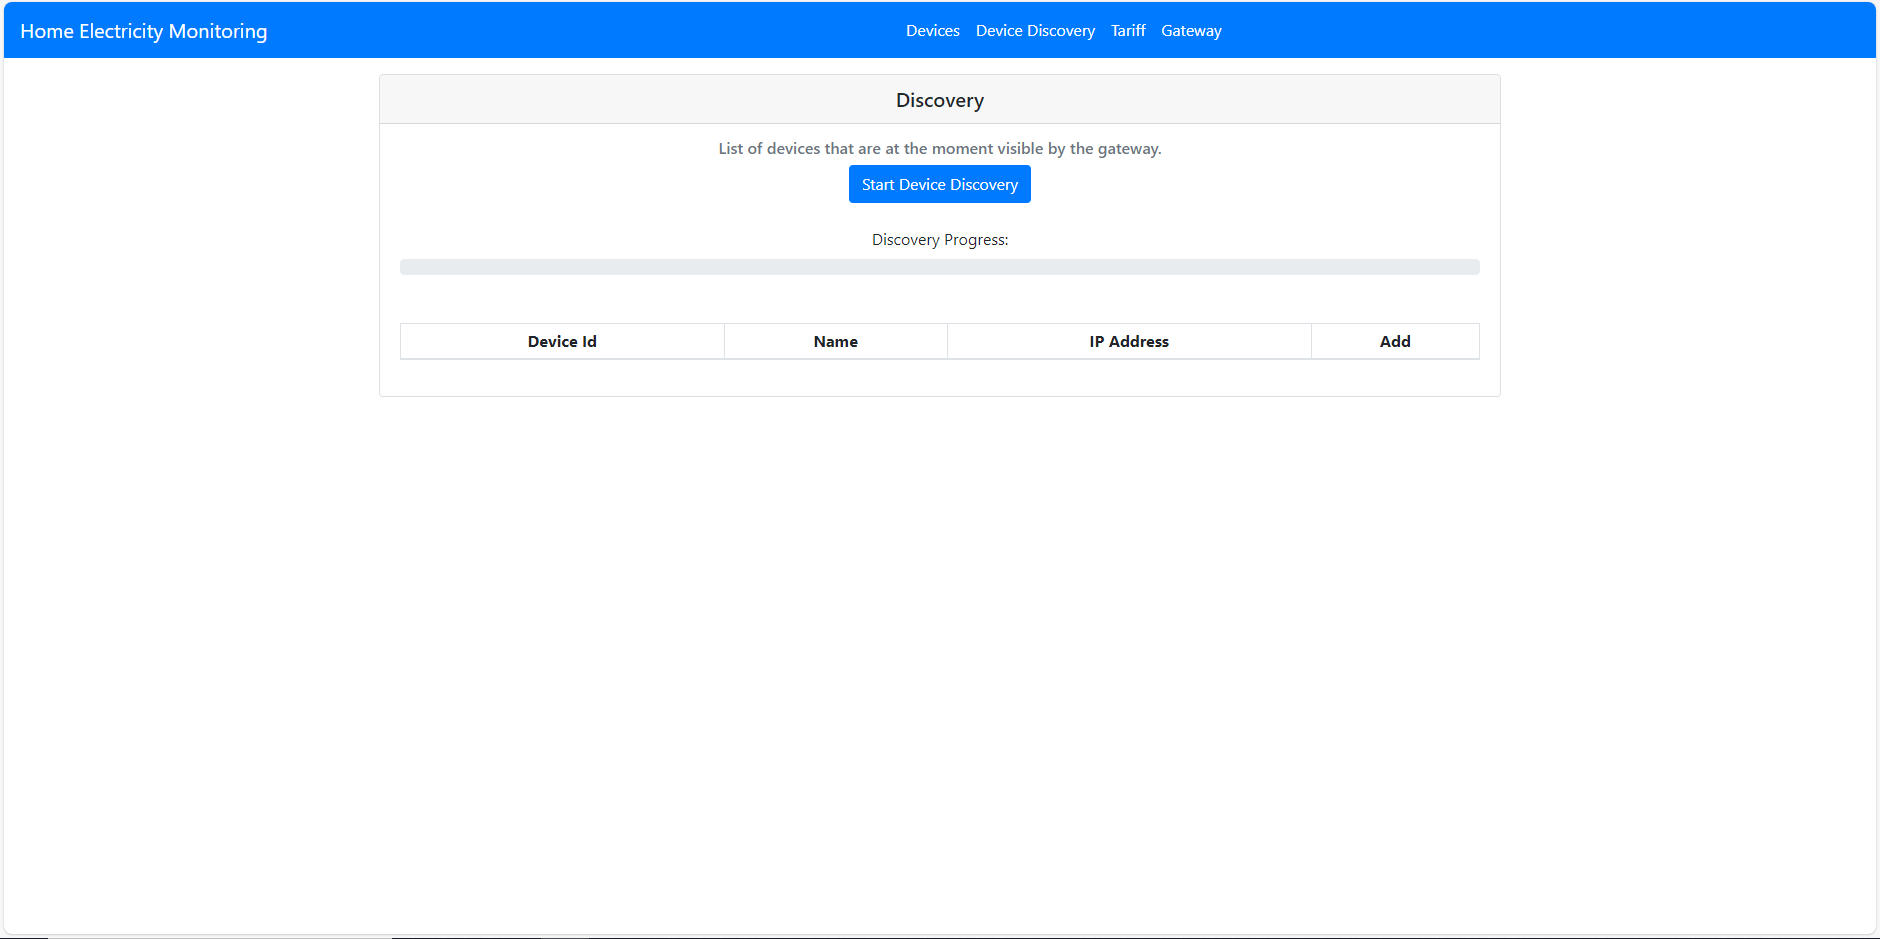
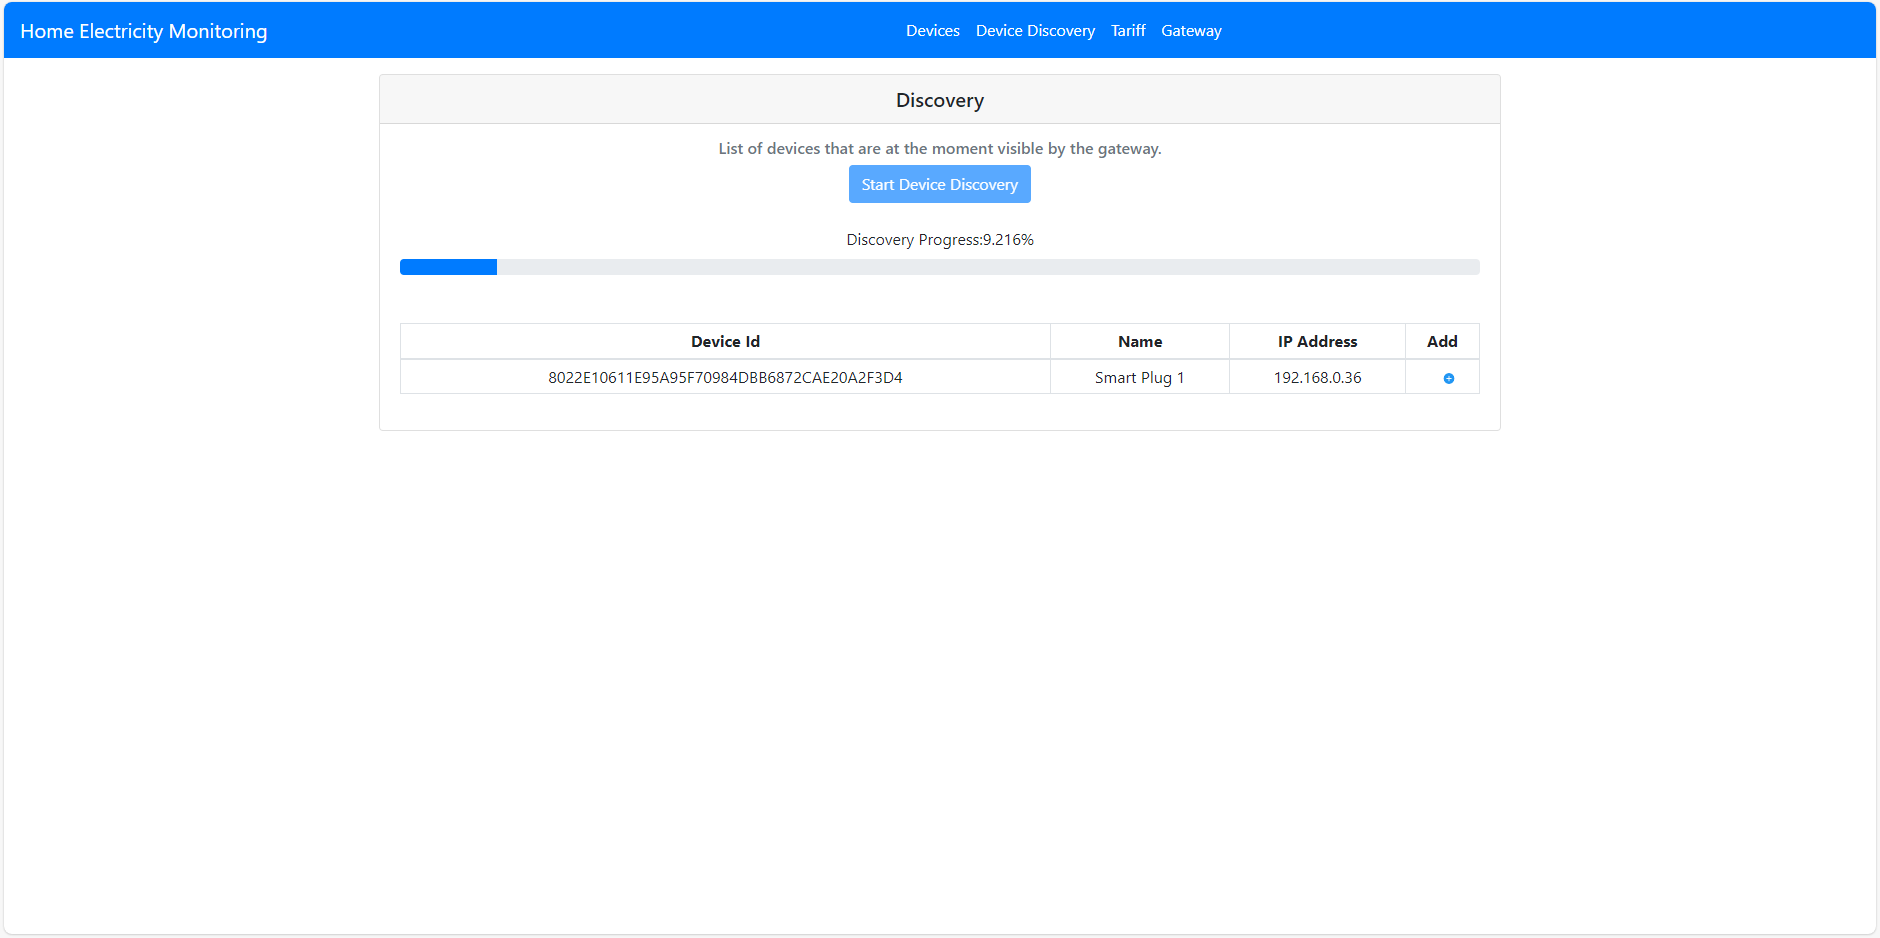
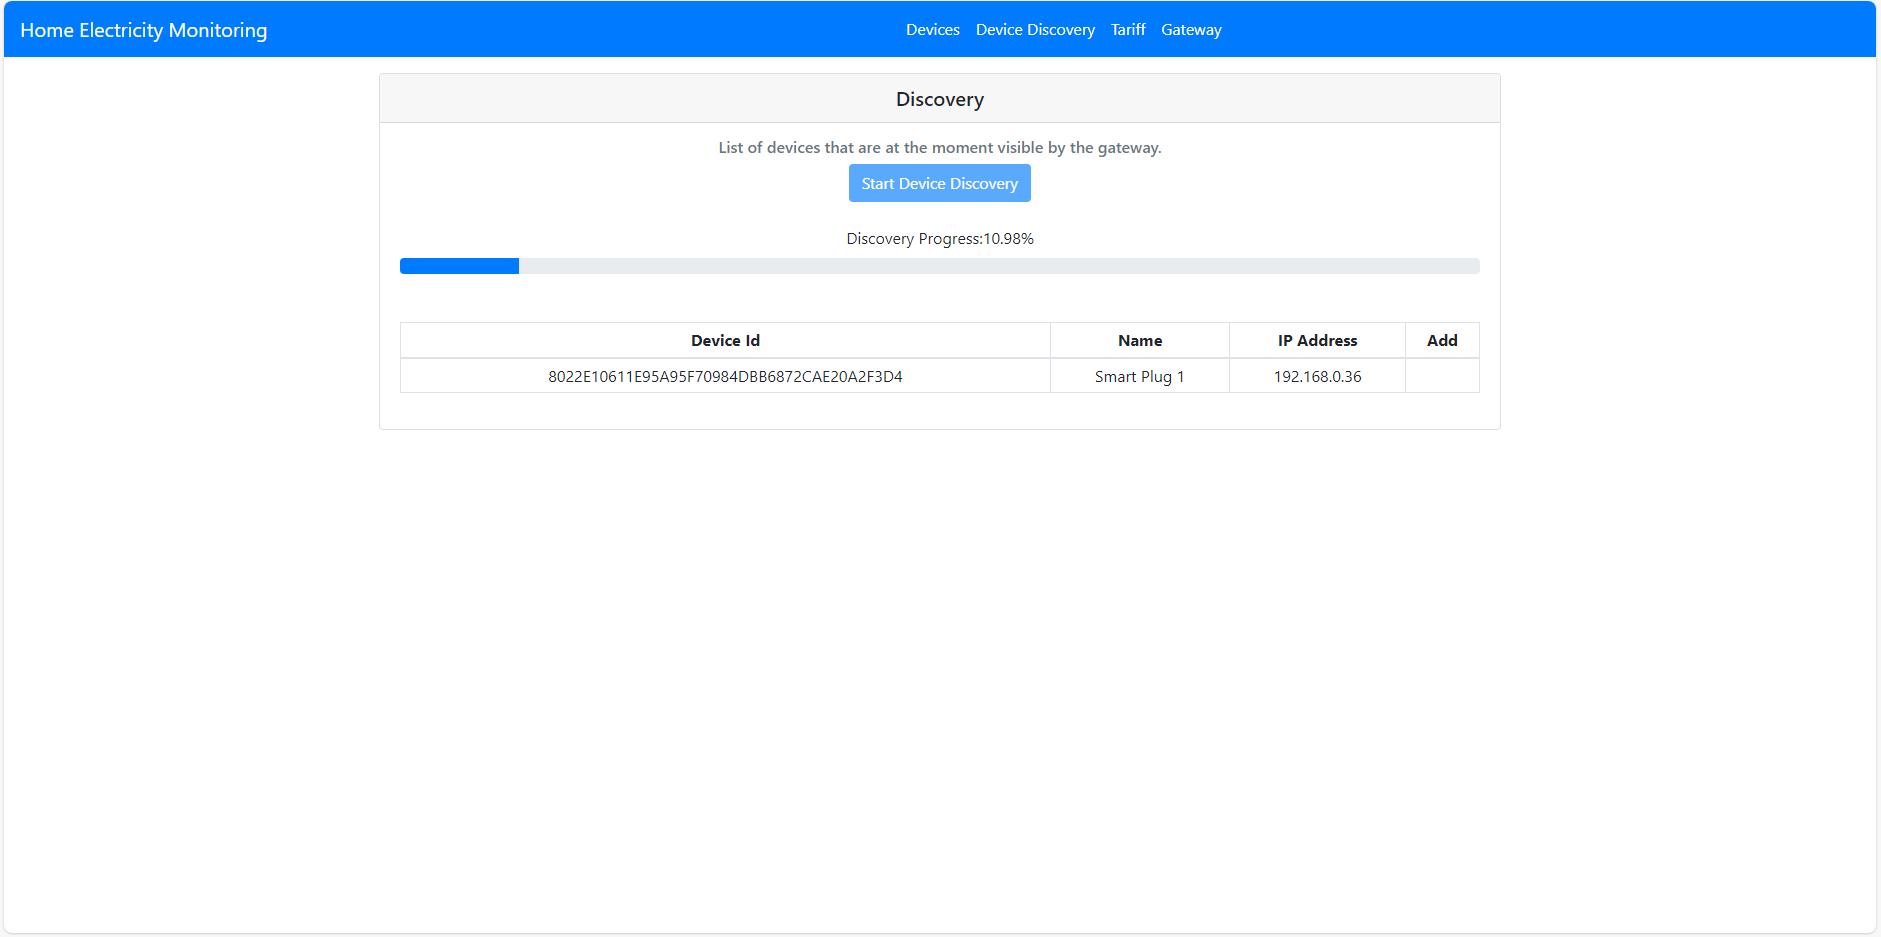
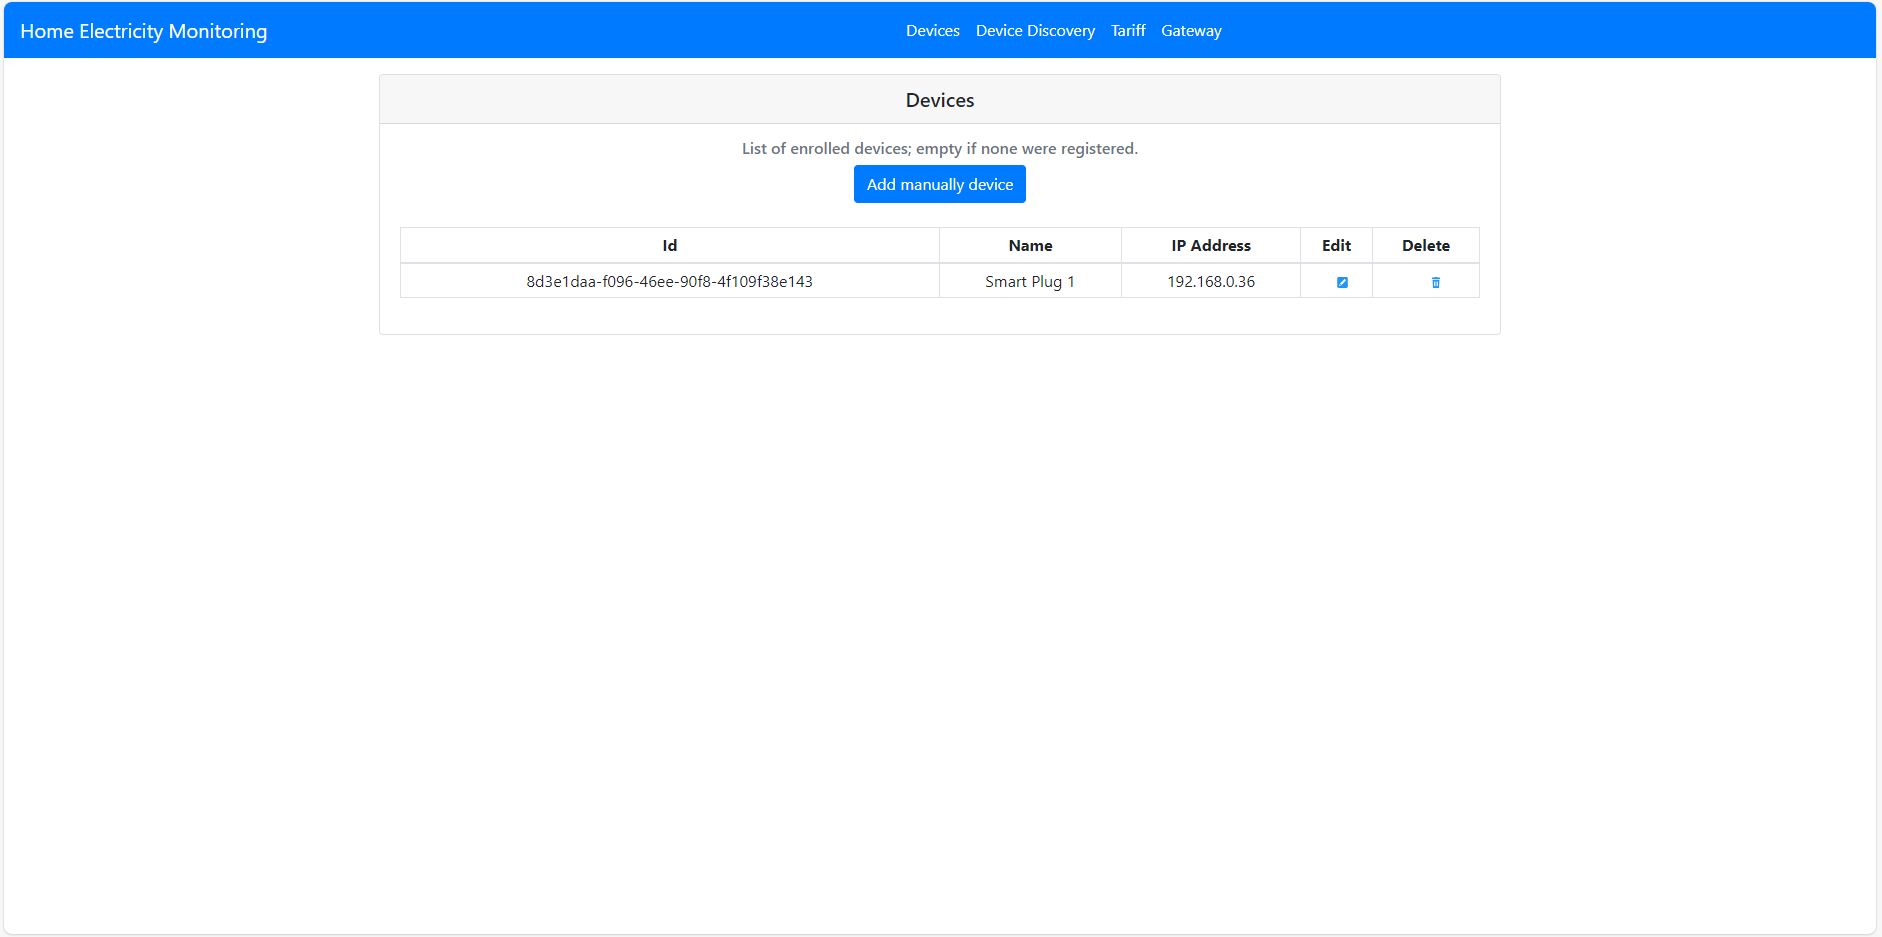
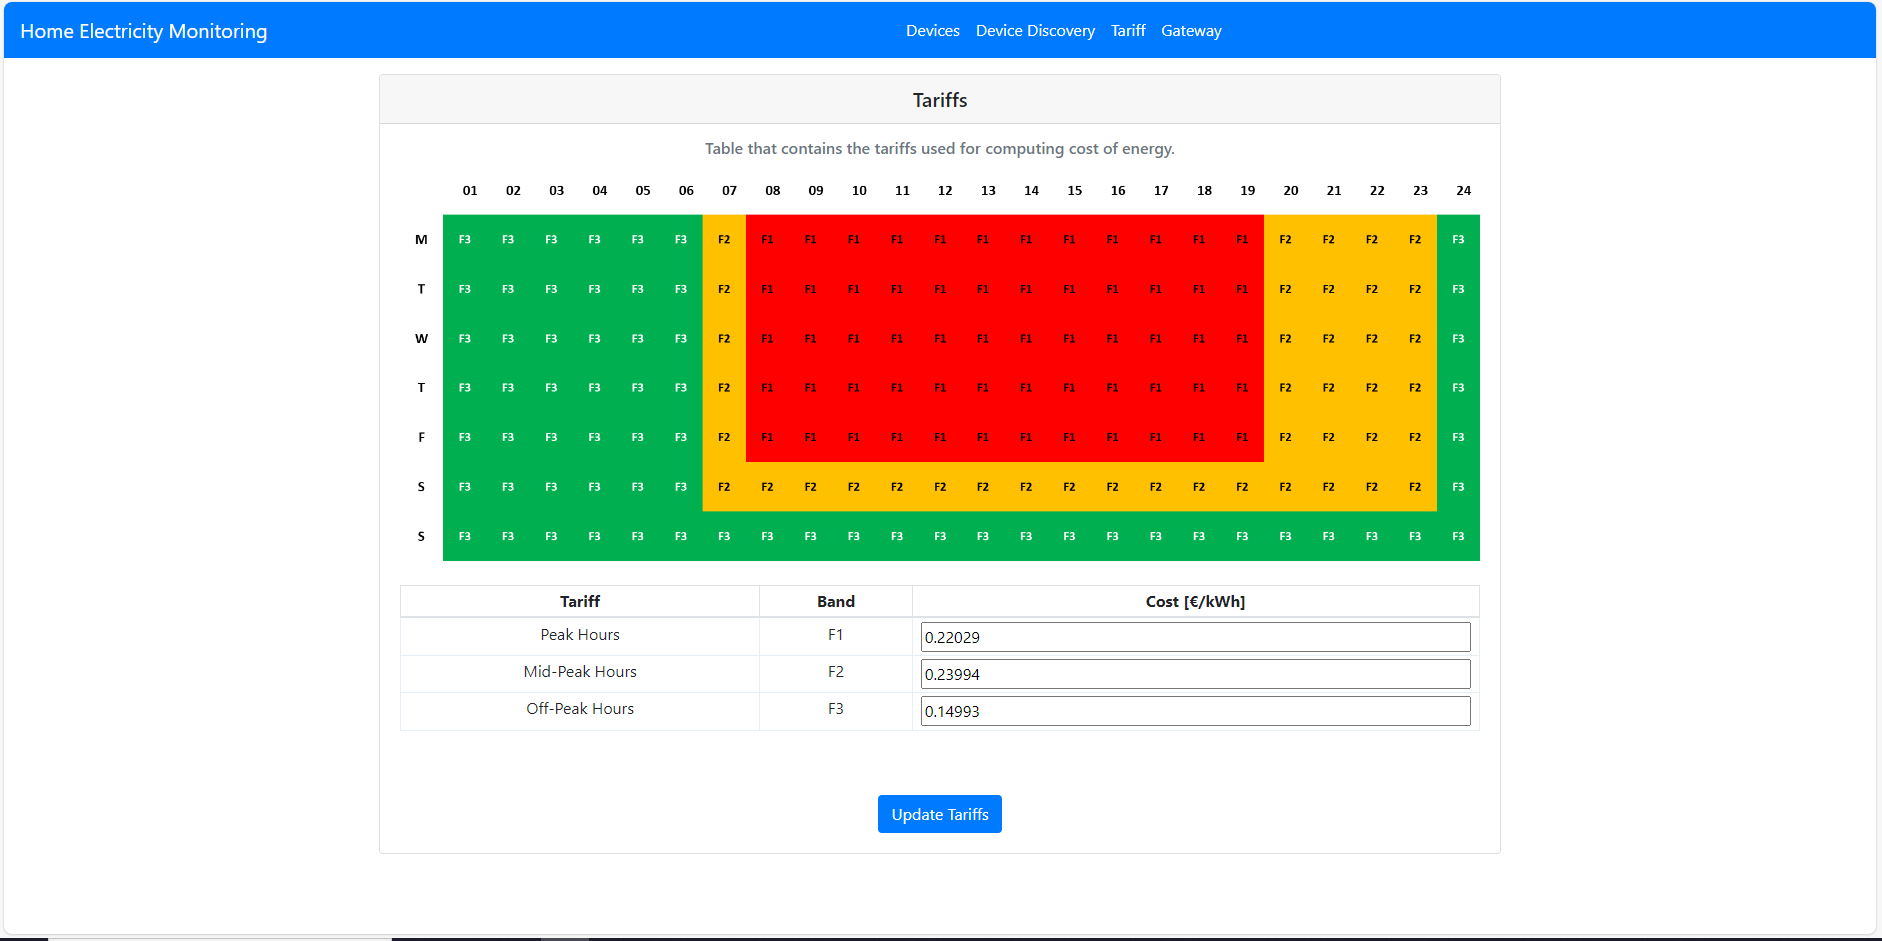
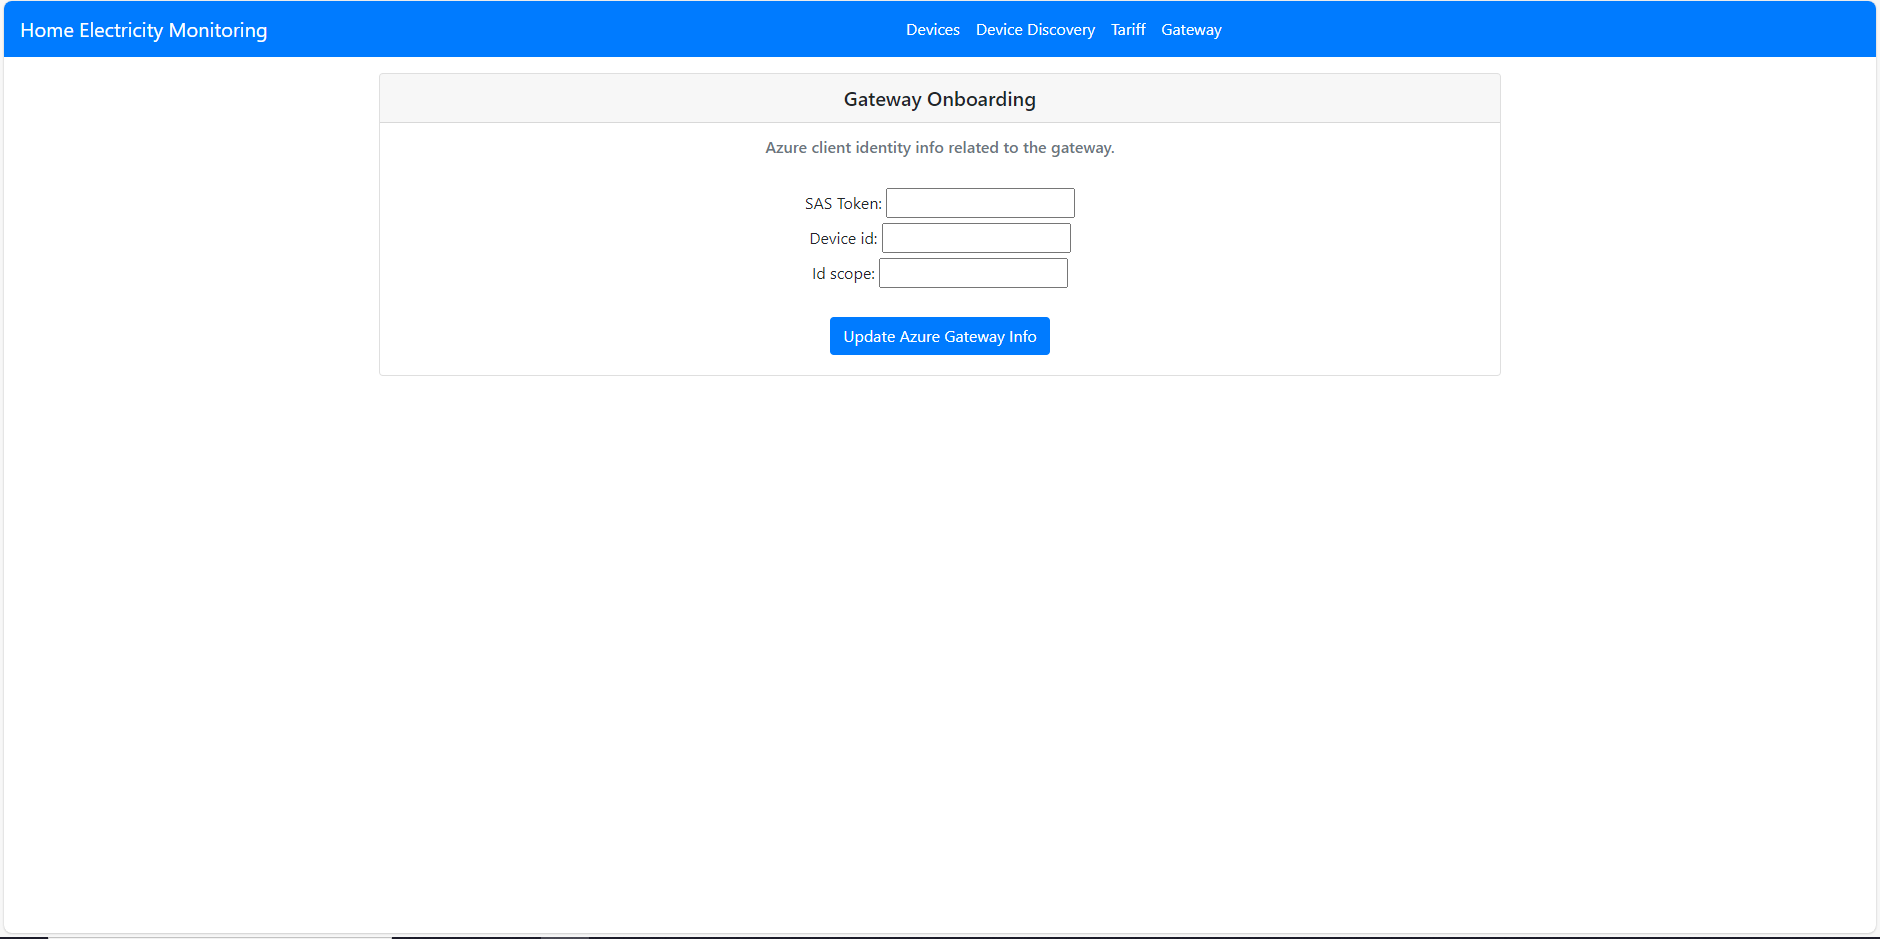
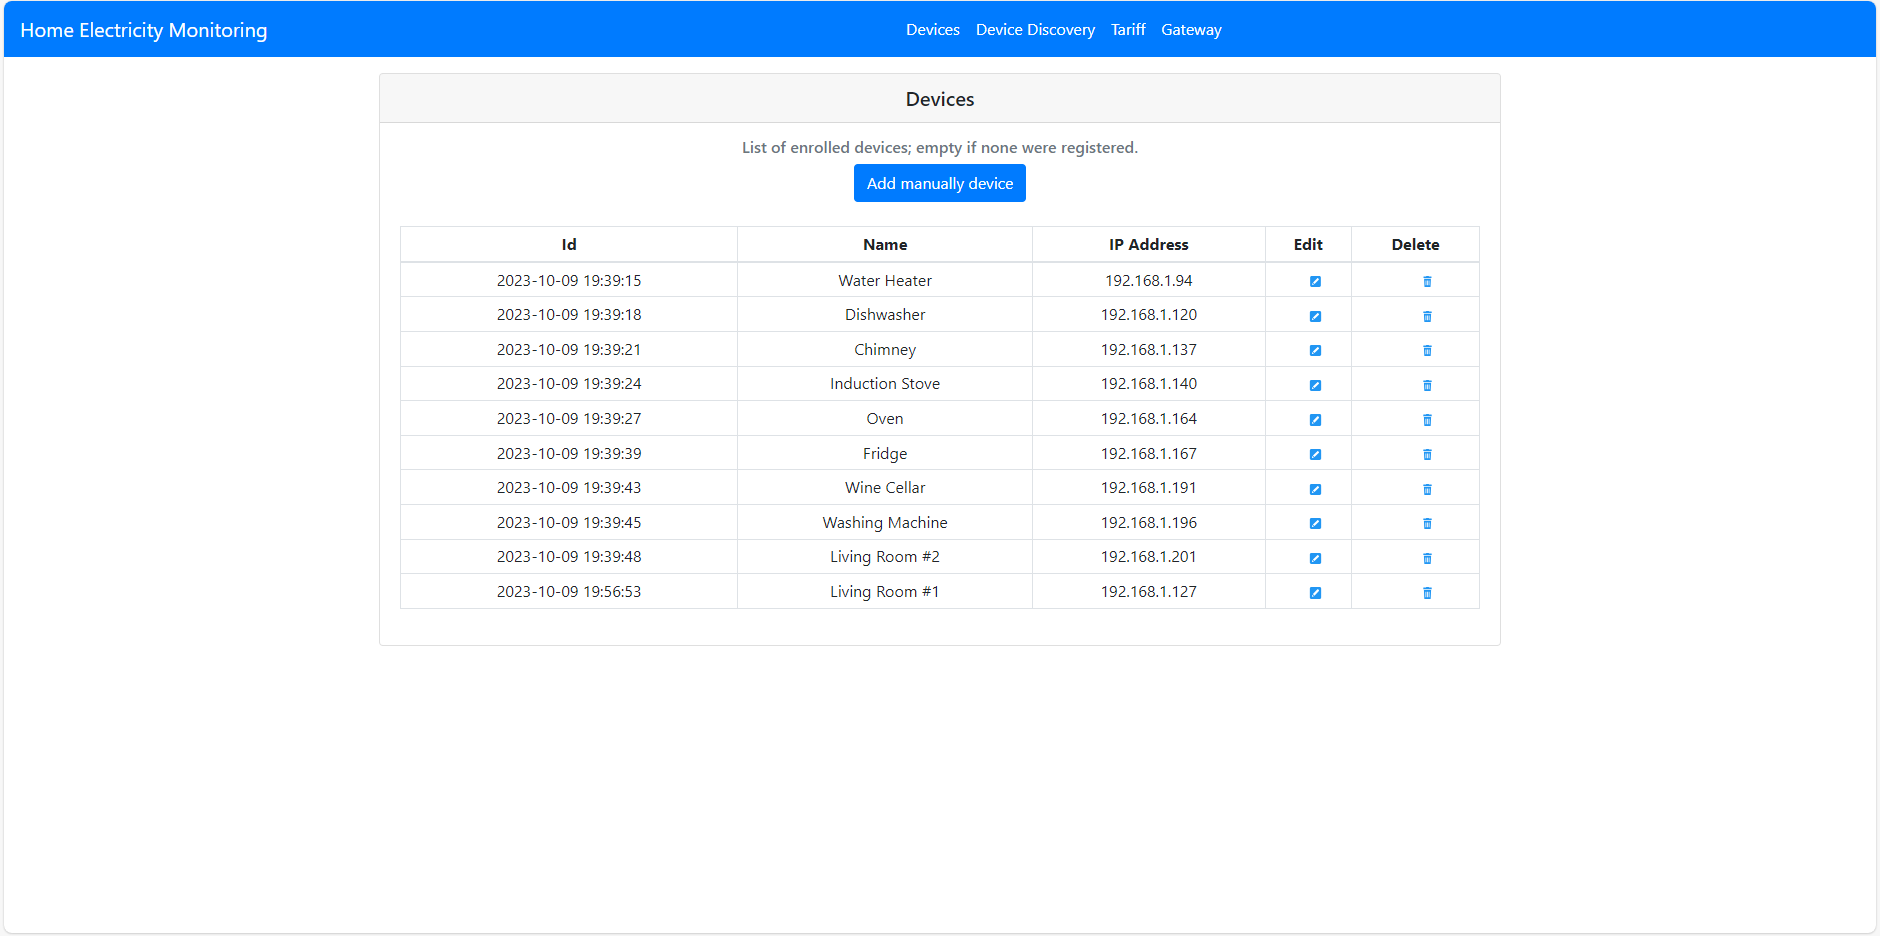
Local Web App
Here below some of the screenshots of the Web App pages that allow to interact with the software.

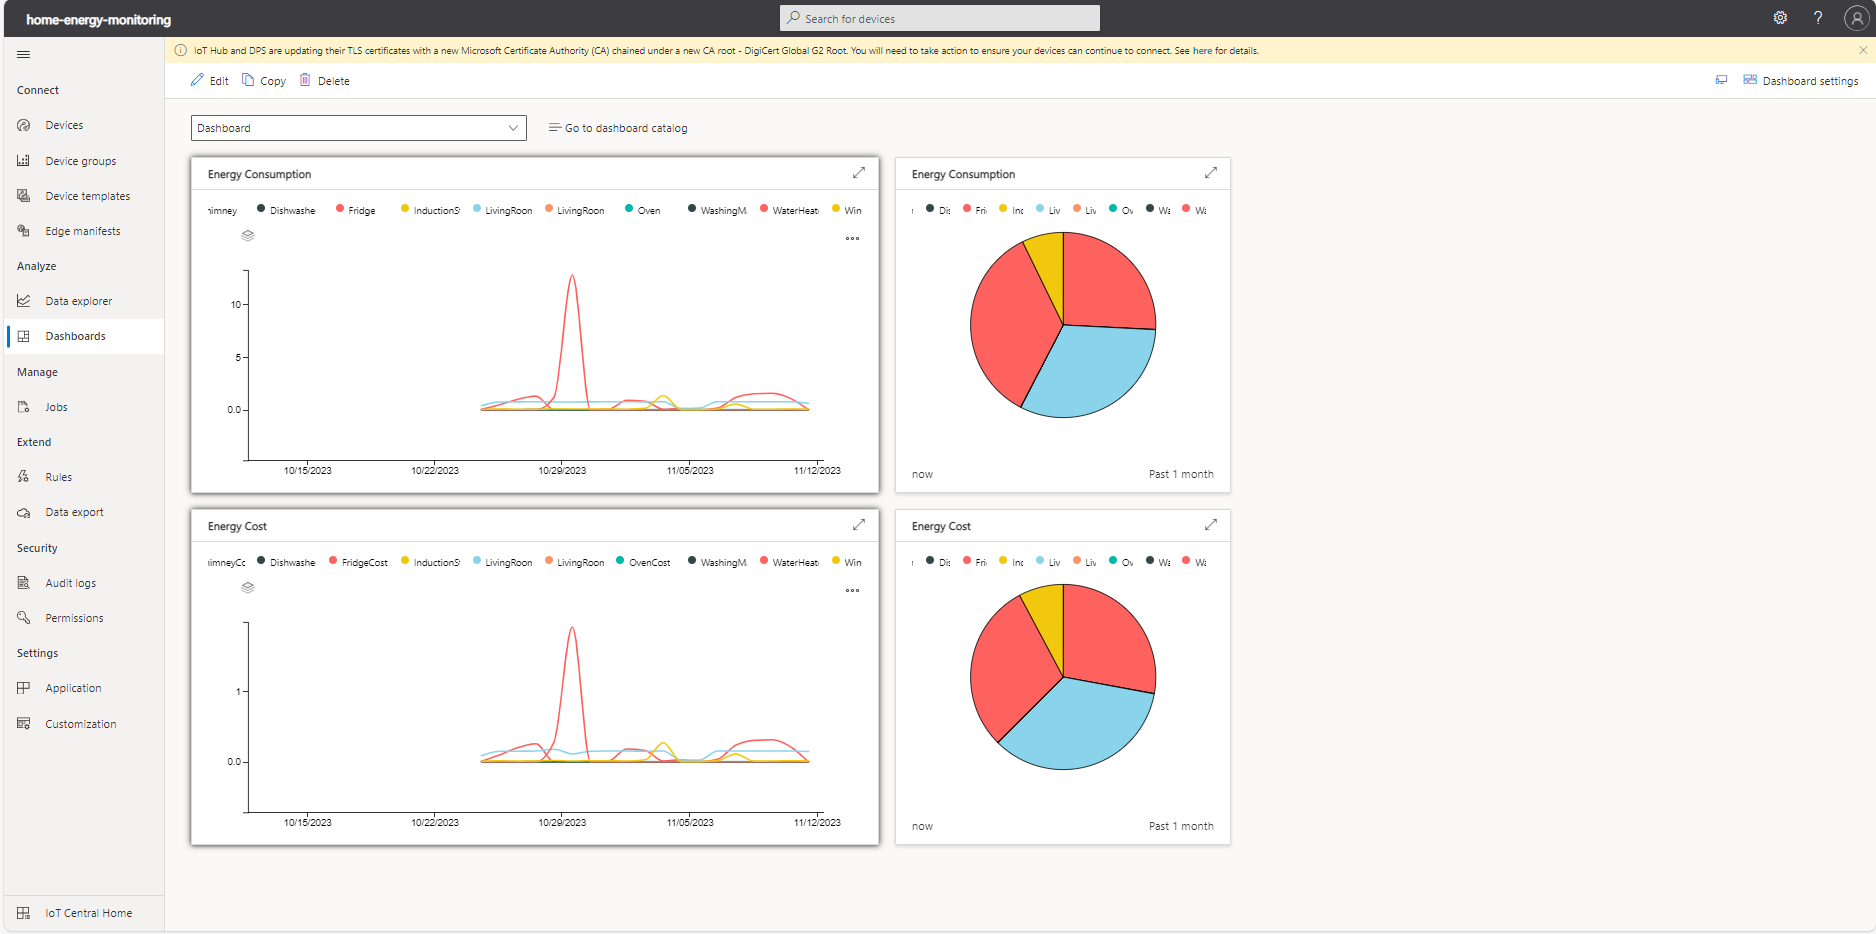
IoT Central
In this section there are screenshots of the dashboard configured in the Azure IoT Central.
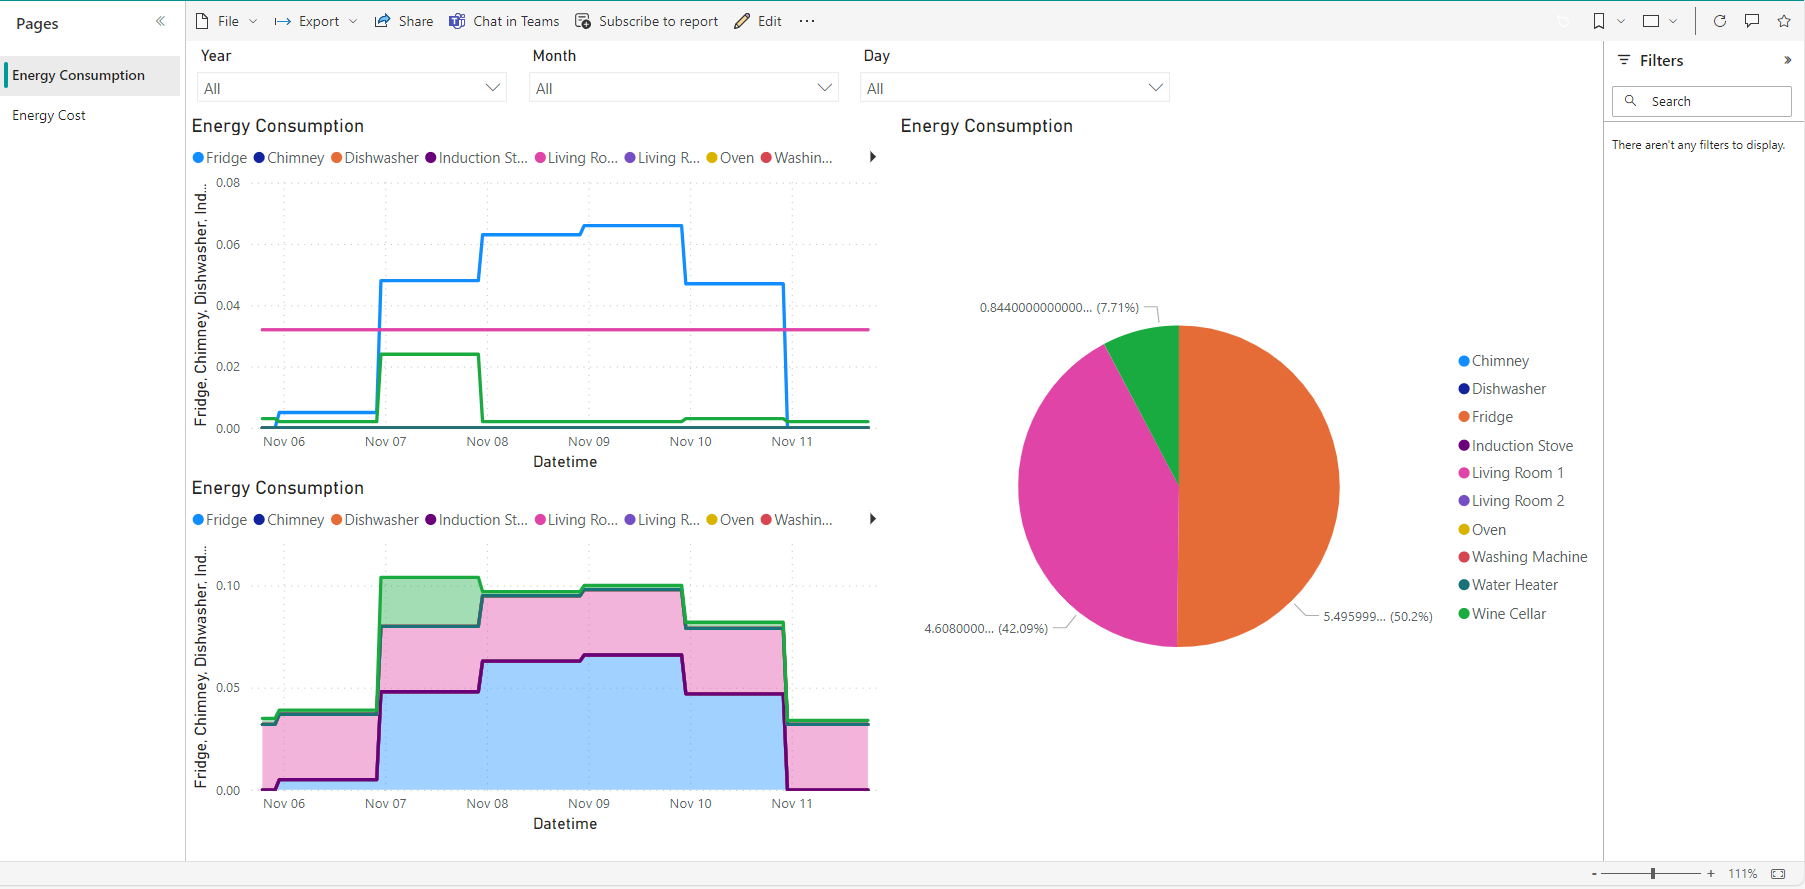
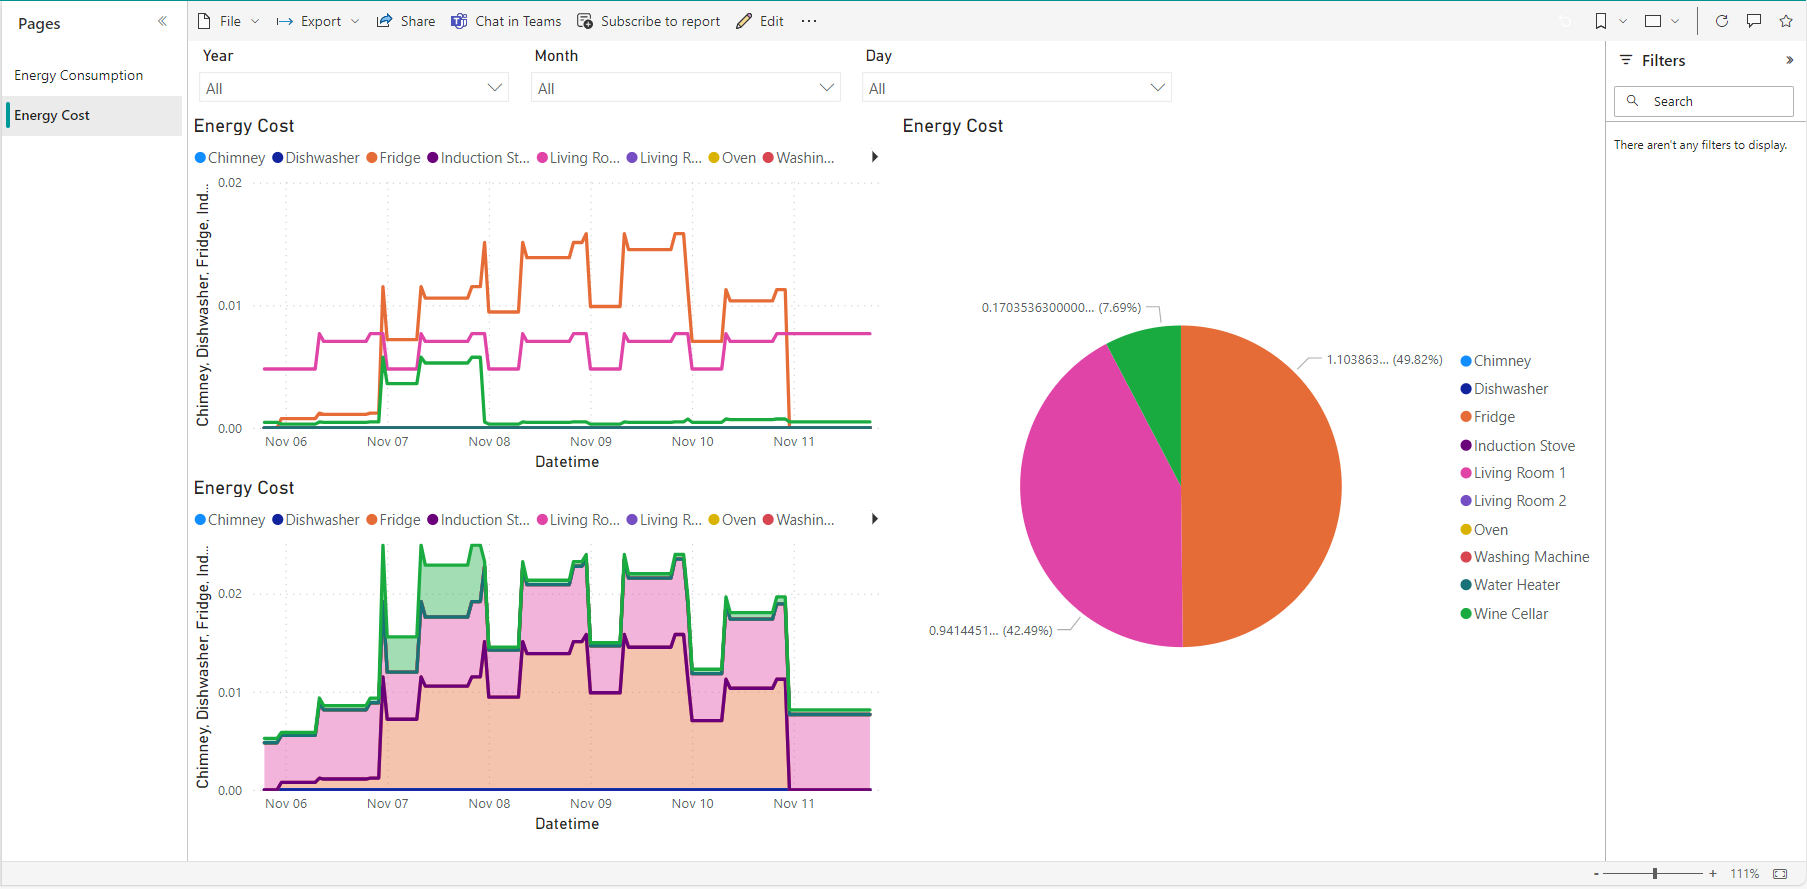
Power BI
Here below some screenshot of the live Power BI dashboard fed by data stored on Azure Data Lake Storage v2.