A chess example for an artificial intelligence algorithm
The project was to develop and prove with an example a artificial intelligence algorithm. I used Matlab for this project because of the easy and fast usability of the tools.
The project consisted in placing 4 queens in a 4×4 chess board without any conflict among them. The solution is found iteratively obviously.
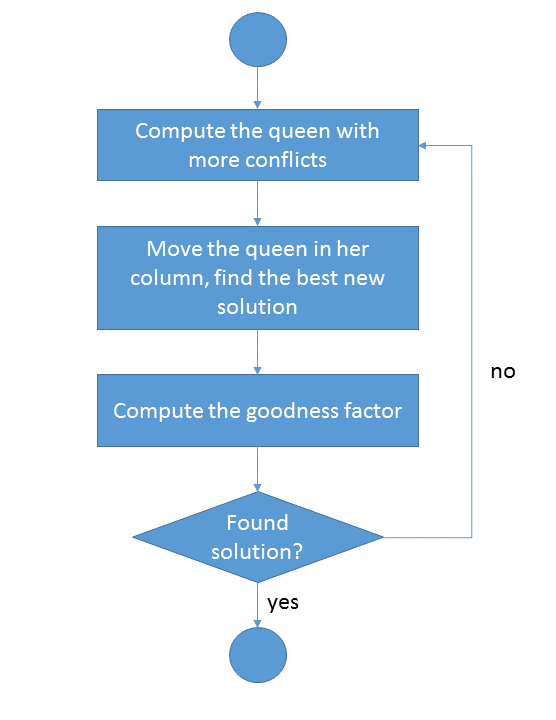
The description of the working operations is well explained in figure 1 and figure 2.
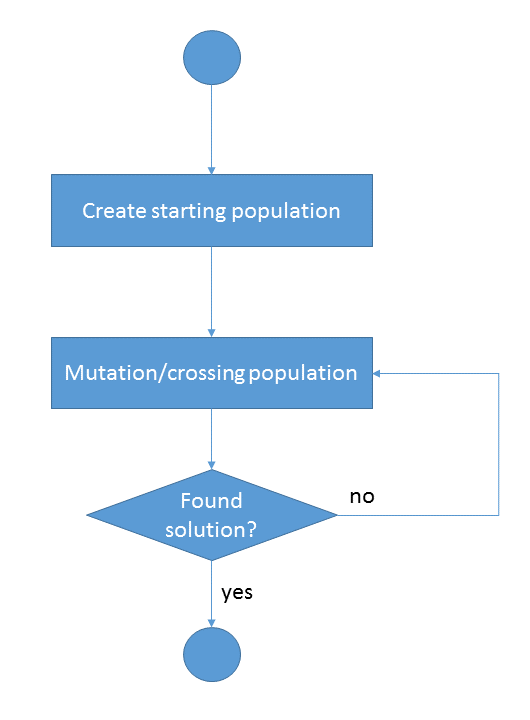
Creation of the starting population
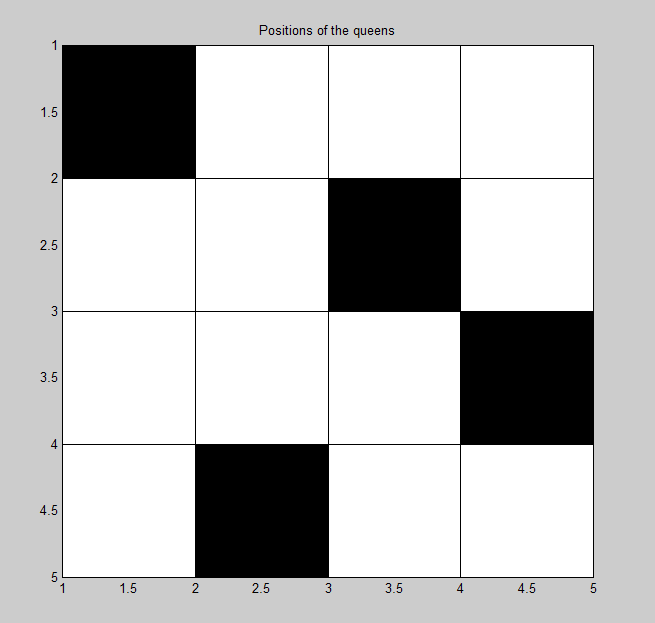
As we can see the first step is the creation of a starting population. In the analogy of the artificial intelligence, the column is the gene and the row number is the allele. Since I adopted a chess board 4×4, I decided to place 4 queens in different columns (but can be in same row). The assignment of the row is random.
Mutation/crossing population
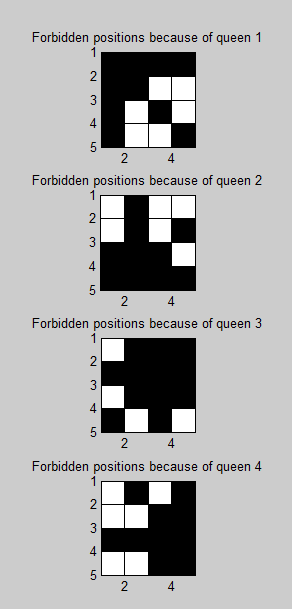
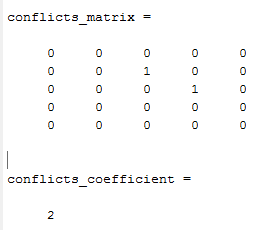
I had to decide then how to implement and gene mutation (so a change in the solution proposed). I computed which of the 4 queens had more conflicts with the others and so that one would be the one to be moved. If more than one queen have the same conflict coefficient, the queen to be moved is chosen randomly.
Chosen the queen, the problem is where to move it. Will be evaluated all the other three rows in which the queen can stay and to every possible new position will be assigned a conflict coefficient (i.e. the number of conflicts that is going to cause the queen if placed in that position). The algorithm will choose the row that will cause less conflicts and if more than one have the same conflict coefficient, the row will be chosen randomly as before.
Stopping condition
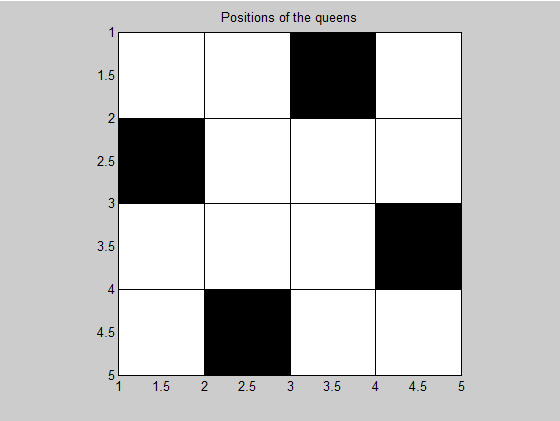
Moved then the queen, will be computed the goodness factor that is the number of overall conflicts generated in the chessboard. If the goodness factor is 0, the algorithm found a solution.
Following this brief explanation I expose few images that show the results of the program. For any further information you can download the Matlab functions and scripts relative to this project.